Introduction
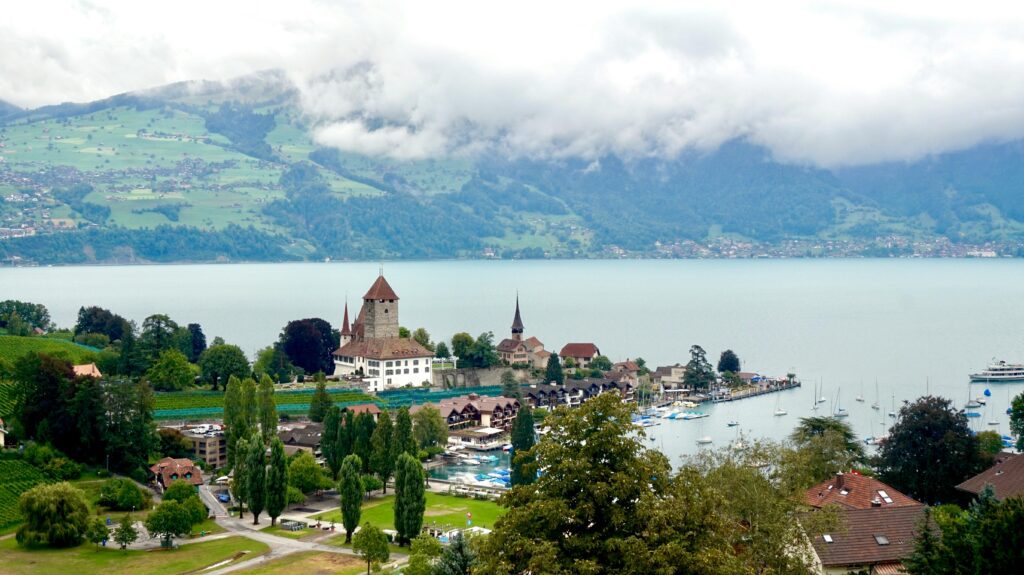
Consistently ranked high on the human development index and with the sixth highest GDP-per-capita, Switzerland is considered a competitive economy on the global stage. Competitiveness is fueled by the primarily services-based economy, with 74% of its GDP coming from the services sector and 25% from industry. Switzerland has a population of around 9 million, with a population growth rate of around 1% in recent years. Recently, tariffs and uncertainty regarding trade deals have led to lower growth in the pharmaceutical industry, which accounts for half of Swiss economic growth, raising concerns that overall GDP growth may slow in the future.
Macroeconomic Indicators
The previous graph shows the relationship between education, gender, and labor markets over time in Switzerland. The data illustrates that women with a higher education have had a lower employment rate than men throughout the last thirty years. Additionally, it shows a steep drop in the labor market’s education in the 1990s. This shows a higher demand for unskilled workers throughout the years. This idea is strengthened with the declining rate of highly educated agents in the economy.
Macroeconomic Analysis and Predictions
1. The 2015 Capping of the Swiss Franc
I. Introduction
In January of 2015, the Swiss franc was pegged to the euro, capping the exchange rate at 1.2 francs per euro. Before this time, Switzerland was an expensive place to do business, one of the most expensive in Europe. This policy took place when Switzerland was a haven for investment in Europe, causing the franc to become highly overvalued and making Swiss exports expensive. By weakening the currency, the policy increased net exports, as Swiss goods became cheaper for foreign buyers and imports became more expensive, leading aggregate demand to shift outward. At the same time, the depreciation of the franc raised the cost of imported raw materials and intermediate goods, increasing production costs for firms and causing the short-run aggregate supply to shift inward. Overall, this policy affected both aggregate demand and aggregate supply, increasing demand through exports while also putting upward pressure on costs and prices, shifting supply.
II. Model-Based Analysis
AD AS Diagram
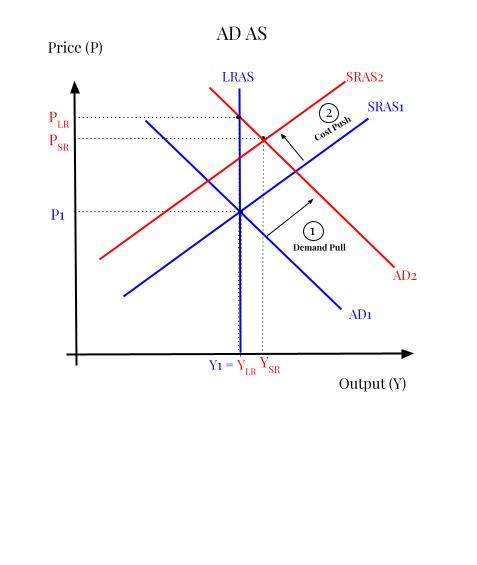
AD ↑: A weaker franc raises net exports and increases domestic demand for Swiss-produced goods by making imports relatively more expensive, so AD shifts to the right
SRAS ↓: At the same time, a weaker franc makes imported goods and imported inputs more expensive, so firms face higher costs. That shifts SRAS left.
IS LM
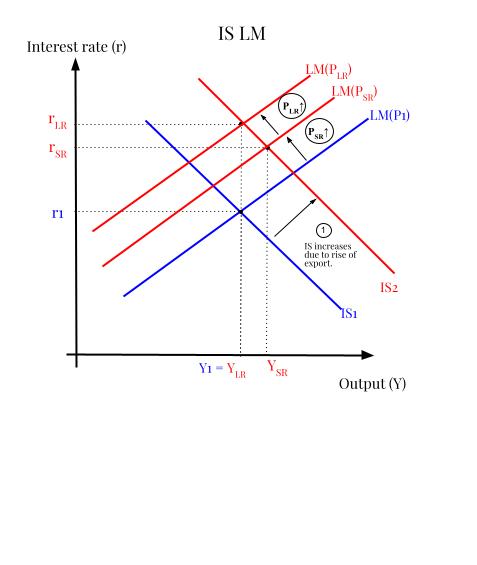
IS ↑: Because the peg keeps the franc weaker, Swiss exports rise, and domestic buyers switch some spending away from imports toward Swiss goods. That raises planned expenditure at each interest rate, so IS shifts to the right.
LM ↓: The peg raises the price level in the short run and even more in the long run. Since real money balances are lower, it shifts LM to the left, first in the short run and further in the long run.
Labor Market
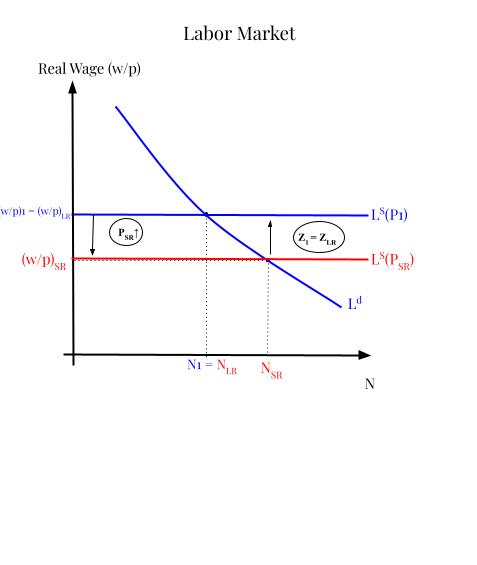
SR: Because the peg raises the price level in the short run while expected prices have not yet fully adjusted, the labor supply shifts downward. As a result, the real wage falls, and employment rises.
LR: Since the expected price and price are equal and Z does not change, the labor supply returns to the same real-wage level as before. Therefore, the economy returns to its natural level of employment, and the real wage returns to its original level.
III. Comparison with Real Economic Outcomes
CHF/EUR Cap
| SR Expected | SR Actual | LR Expected | LR Actual | |
|---|---|---|---|---|
| P | ↑ | ↓ | ↑↑ | ↓↓ |
| Y | ↑ | ↓ | No Δ | No Δ |
| r | ↑ | ↓ | ↑ | ↓↓ |
| I | Amb. | ↑ then No Δ | No Δ | No Δ |
| C | ↑ | ↑ | No Δ | ↑ |
| N | ↑ | ↑ then ↓ | No Δ | ↓ |
| W/P | ↓ | ↑ | No Δ | ↑ |
IV. Discrepancies and Interpretation
Model inaccuracies and possible explanations
Prices actually fell, one reason that could explain the model miss was the implementation of stricter regulations on banks, causing higher liquidity requirements and lowering the money supply/money multiplier, which would shift AD inward and lower prices.
Cost-pull likely outpaced demand push, causing a lower output in the short term vs the expected rise from our model. For the interest rate, consumer sentiment likely fell because of households seeing a decrease in the relative value of their currency and assets.
Refinements to the model:
Accounting for how consumers would respond to a decrease in the value of their currency explains many of the model misses (such as the short-run drops in P and Y). Looking at the flow of Switzerland’s currency and how the exchange rate cap changed the inflow and outflow of capital could explain the short-term investment changes, as well as the employment level. Finally, policy changes that directly impact the money supply could be incorporated to better model interest rate changes.
2. Switzerland's Debt Brake
I. Introduction
II. Model Based Analysis
AD AS
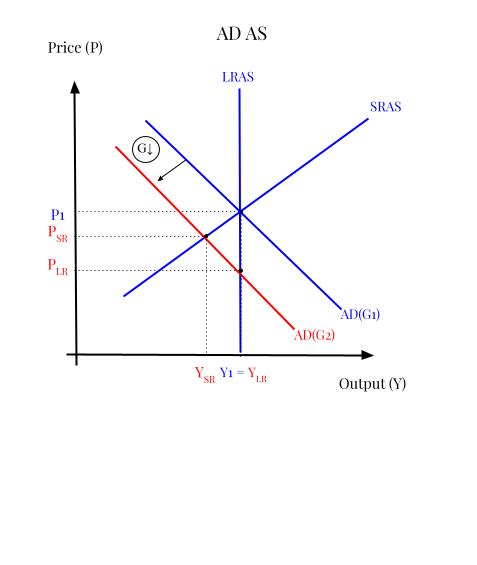
G↓: The Swiss debt brake lowered government spending because the government did not implement tax reforms to raise revenue during this time. This means it had to rely on spending cuts to stay within the debt limit.
AD↓: Because government spending is a component of aggregate demand, if the debt brake causes the government to cut spending, then AD falls and shifts left.
IS LM
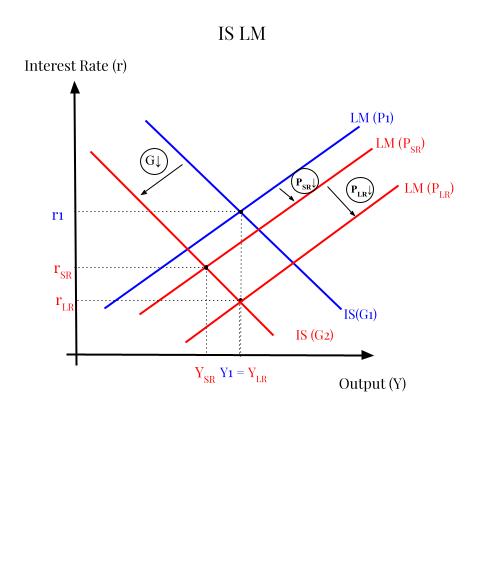
IS↓: The debt brake shifts the IS curve leftward because lower government spending reduces government purchases, thereby lowering total planned spending in the goods market at every interest rate.
LM↑: As the lower AD reduces the price level, real money rises and shifts LM to the right, first in the short run and further in the long run.
Labor Market
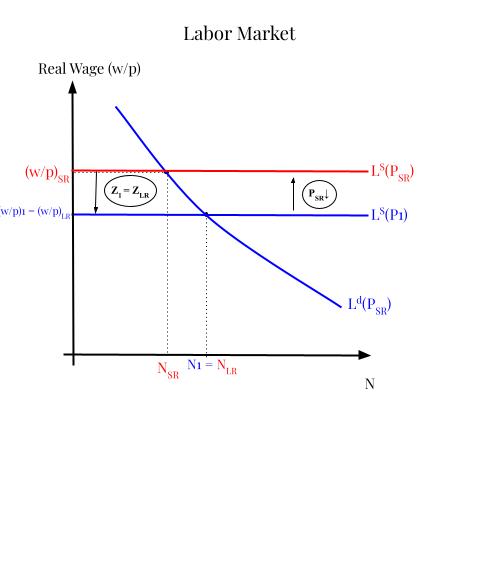
SR: The fall in aggregate demand lowers the price level, and because nominal wages do not adjust immediately, the real wage rises in the short run, shifting the economy up along the labor demand curve and reducing employment.
LR: Since expected price equals actual price and zzz is unchanged, labor supply returns to its initial position, so the equilibrium real wage and employment return to their initial levels.
III. Comparison with Real Economic Outcomes
Debt Brake
| SR Expected | SR Actual | LR Expected | LR Actual | |
|---|---|---|---|---|
| P | ↓ | ↑ | ↓↓ | Amb. |
| Y | ↓ | ↑ | No Δ | No Δ |
| r | ↓ | Mixed | Amb. | ↓↓ |
| I | ↑ | No Δ | ↓↓ | No Δ |
| C | Amb. | ↓ | ↓↓ | No Δ |
| N | ↓ | ↓ | No Δ | No Δ |
| W/P | ↑ | ↓ | No Δ | ↑ |
IV. Discrepancies and Interpretation
Model Inaccuracies and Possible Explanations
The model was inaccurate regarding interest rates, investment, and consumption, with variations in consumer sentiment, government spending, and animal spirits causing mixed results that we hadn’t accounted for. One explanation for interest rates seems to be that in the short term, expansionary monetary policy was implemented, but by 2006, rates were being raised again as the economy improved. Tax cuts partially offset the contractionary effect of the G decrease, which could explain why P and Y rose in the short run rather than falling as expected.
Refinements to the Model
The model could be improved by incorporating household and business data to better gauge consumer sentiment and animal spirits, as well as price and interest rate expectations. Another key variable would be the marginal propensity to consume, to see precisely how consumers respond to government spending decreases in regard to savings. This would have helped predict the short-run drop in C that the model left ambiguous. Lastly, monetary policy should have been accounted for to see how that offset interest rate changes.
Extreme Macroeconomic Event and Economic Growth
1. Ukraine War
Event Description and Historical Context
Switzerland’s 2022 Ukraine-war energy shock occurred after Russia invaded Ukraine in February 2022. The war disrupted European and global energy markets because Russia had been a major supplier of oil and natural gas to Europe. As uncertainty over energy supply increased, oil, gas, and electricity prices rose sharply across Europe.
The shock came at a time when European energy markets were already under pressure from the post-COVID recovery. During this period, energy demand had risen while the flow of goods and energy remained strained. Before the shock, Switzerland had relatively low inflation and stable economic conditions. However, Switzerland was still exposed because it relies on imported energy and is closely connected to European gas and electricity markets. As a result, the disruption caused by the war quickly became an energy-price shock for Switzerland as well.
Macroeconomic Impacts
Description
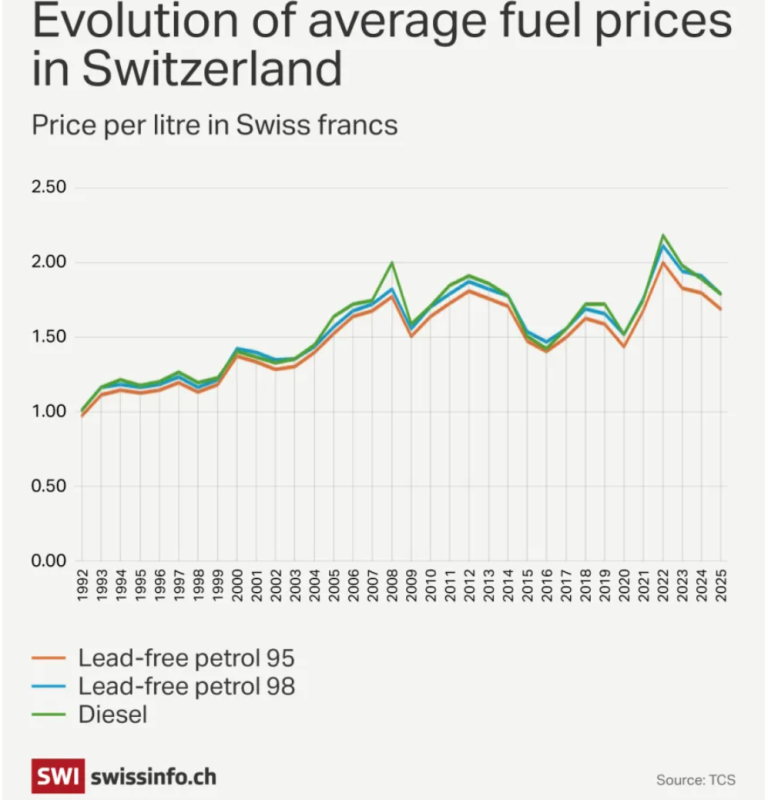
Switzerland’s 2022 Ukraine-war energy shock demonstrated an example of rising prices due to cost-push inflation. Consumer prices rose from 0.58% in 2021 to 2.84% in 2022 and remained at those levels until late 2023. The decline in output can directly be seen through the Real GDP growth rate dropping from 5.56% in 2021 to 3% in 2022 and even further to 0.68% in 2023.
On the other hand, the labor market was resilient, with unemployment actually falling from 2021 (5%) to 2022/2023, hovering around 4%. So, Switzerland absorbed the shock mainly through an increase in prices and slower growth.
Mechanism
| Stage | Channel | Effect |
|---|---|---|
| 1 | Energy CPI | +22.4% in 2022 |
| 2 | Production costs | Rise across firms |
| 3 | Aggregate supply | SRAS shifts left |
| 4 | Equilibrium | Higher prices, lower output |
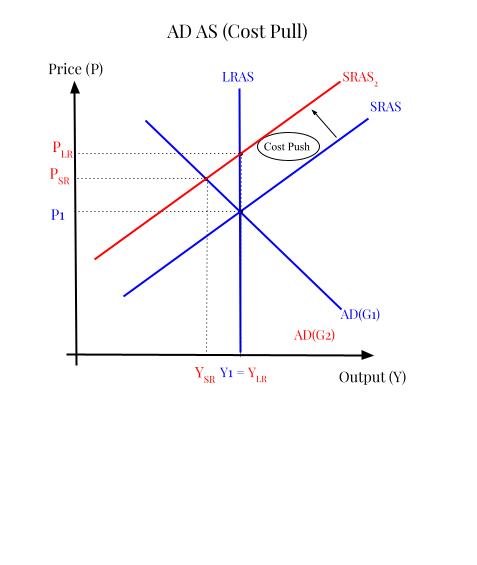
The energy CPI for Switzerland rose 22.4$ in 2022, alongside a spike in fuel prices. This increase in gas, oil, and electricity prices raised the cost of production, which shifted short-run aggregate supply to the left (cost-push inflation / supply shock), causing an increase in prices overall.
The rising prices were partially offset by countercyclical monetary policy implemented by the SNB throughout 2022 and 2023, with aggressive rate hikes from -0.75% to 1.75%.
Data and Visualization
I. AD AS
II. CPI: Energy
Figure. Switzerland energy CPI growth, annual. This graph shows changes in Switzerland’s energy prices over time. The rise around 2022 supports the idea that the Ukraine-war energy shock increased energy costs in Switzerland. Source: OECD via FRED.
III. Fuel Prices
Policy Response and Aftermath
After the outbreak of the Russian invasion of Ukraine, Switzerland faced a sharp energy price shock due to its reliance on imported energy, especially natural gas and electricity markets linked to Europe. Rising oil and gas prices increased production costs and inflation, even though Switzerland experienced lower inflation than many EU countries. In response, the Swiss National Bank shifted from a very loose monetary policy to tightening, raising interest rates to control inflation and stabilize the economy. Overall, Swiss economic policy during this period aimed to absorb the external energy shock while maintaining price stability and protecting long-term economic resilience, even at the cost of slower GDP growth.
2. Economic Growth
Overview of Growth Patterns
Real GDP Growth by Period
| Period | Avg. Real GDP Growth | Notes |
|---|---|---|
| 1960s | 4.63% | Peak post-war expansion |
| 1970s | ~1% | Severe recession in 1975 (−7.28%) |
| 1990s | ~1% | Prolonged stagnation |
| 2000s+ | ~2% | Stable; recessions in 2009, 2020 |
Drivers of Economic Growth
In the long run, Switzerland has seen continued growth, but, like all economies, there have been expansions and recessions throughout. One notable decade is the 1960s, where real GDP growth averaged 4.63% per year. This would sharply decrease and hover around 1% throughout the 70s and 90s, with a severe decline of -7.28% in 1975. The 2000s would have higher growth around the 2% level, with fewer recessions (but some, such as 2009 and 2020) and stable growth trends.
Switzerland’s long-run growth has been driven by changes in the composition of the economy. Early growth was primarily driven by capital investment and industrial expansion. Over time, this has shifted towards focusing on productivity, innovation, and a services-based economy. This can primarily be seen through agriculture and industry’s declining share of GDP (although industry has remained more stable overall). Global integration has been another key driver of GDP, with Switzerland’s pharmaceutical and high-precision manufacturing sectors seeing growth in particular. Meanwhile, the population and labor force have remained fairly steady throughout.
Data and Visualization
I. GDP Growth Rate
Figure. Switzerland GDP growth, annual rate. Switzerland’s GDP growth has been steady overall but not extremely fast, with clear downturns during major shocks. After the strong post-war expansion, growth became slower and more moderate. Source: World Bank.
II. GDP per Capita
Figure. Switzerland GDP per capita. Switzerland’s GDP per capita has generally risen over time, with output and income per person having increased. The upward trend supports the idea that Switzerland has remained a wealthy, high-income economy despite periods of slower GDP growth. Source: World Bank.
III. Labor Productivity
Figure. Switzerland Productivity. Switzerland’s labor productivity has steadily increased, which means the economy produces more output per hour worked. Source: Our World in Data.
Interpretation
Switzerland’s economic history, 1975–2024
Over the past 50 years, Switzerland’s GDP growth has usually been steady but not extremely fast. Its economy depends heavily on exports, finance, pharmaceuticals, machinery, tourism, and a strong currency. Because of this, Switzerland is affected by global recessions, oil and energy shocks, exchange-rate pressure, and financial crises. The Swiss economy often performs better than many European economies, but growth can slow when the Swiss franc becomes too strong or when global demand weakens.
Citations
- Federal Department of Foreign Affairs. “Swiss Economy – Facts and Figures.” About Switzerland, Presence Switzerland, 2025, www.aboutswitzerland.eda.admin.ch/en/swiss-economy-overview.
- Federal Statistical Office. “Swiss Consumer Price Index: Indexing.” Prices, 2026, www.bfs.admin.ch/bfs/en/home/statistics/prices/consumer-price-index/indexierung.html.
- International Labour Organization. ILO Modelled Estimates Database (ILOEST). ILOSTAT, ilostat.ilo.org/data/bulk.
Macrotrends. “Switzerland GDP (Gross Domestic Product).” Macrotrends, www.macrotrends.net/global-metrics/countries/che/switzerland/gdp-gross-domestic-product. - Organisation for Economic Co-operation and Development. Consumer Electric Prices for Switzerland [CPGREN01CHM657N]. FRED, Federal Reserve Bank of St. Louis, fred.stlouisfed.org/series/CPGREN01CHM657N.
- Organisation for Economic Co-operation and Development. Consumer Price Index: Energy for Switzerland [CPGREN01CHA657N]. FRED, Federal Reserve Bank of St. Louis, fred.stlouisfed.org/series/CPGREN01CHA657N.
- Organisation for Economic Co-operation and Development. Harmonized Unemployment Rate: All Persons for Switzerland (DISCONTINUED) [CHEURHARMADSMEI]. FRED, Federal Reserve Bank of St. Louis, fred.stlouisfed.org/series/CHEURHARMADSMEI.
- Organisation for Economic Co-operation and Development. Infra-Annual Labor Statistics: Monthly Unemployment Rate Female: 15 Years or Over for Switzerland [LRHUTTFECHQ156S]. FRED, Federal Reserve Bank of St. Louis, fred.stlouisfed.org/series/LRHUTTFECHQ156S.
- Organisation for Economic Co-operation and Development. Infra-Annual Labor Statistics: Monthly Unemployment Rate Male: 15 Years or Over for Switzerland [LRHUTTMACHQ156S]. FRED, Federal Reserve Bank of St. Louis, fred.stlouisfed.org/series/LRHUTTMACHQ156S.
- Organisation for Economic Co-operation and Development. Infra-Annual Labor Statistics: Unemployment Rate Total: From 15 to 74 Years for Switzerland [LRUN74TTCHQ156S]. FRED, Federal Reserve Bank of St. Louis, fred.stlouisfed.org/series/LRUN74TTCHQ156S.
- Our World in Data. “Labor Productivity per Hour Worked, Switzerland.” Our World in Data, ourworldindata.org/grapher/labor-productivity-per-hour-pennworldtable?tab=line&country=~CHE.
- Swiss Federal Electricity Commission. “2023 Electricity Prices Press Release.” ElCom, www.elcom.admin.ch.
- Swiss National Bank. “Monetary Policy Decisions.” Swiss National Bank, 16 June 2022, 22 Sept. 2022, 23 Mar. 2023, and 22 June 2023, www.snb.ch/en/the-snb/mandates-goals/statistics/statistics-pub/current_interest_exchange_rates.
- SWI swissinfo.ch. “Switzerland Faces a Steep Energy Bill Due to the Middle East Conflict.” SWI swissinfo.ch, www.swissinfo.ch/eng/climate-adaptation/switzerland-faces-a-steep-energy-bill-due-to-the-middle-east-conflict/91170450.
- SWI swissinfo.ch. “What Lies Ahead for Switzerland: An Economic Outlook for 2026.” SWI swissinfo.ch, 2025, www.swissinfo.ch/eng/agribusiness/what-lies-ahead-for-switzerland-an-economic-outlook-for-2026/90603355.
- Tax Foundation. “OECD Personal Income Tax Rates, 2000–2011.” Tax Foundation, 3 July 2012, taxfoundation.org/blog/oecd-personal-income-tax-rates-2000-2011/.
- United Nations Development Programme. “Human Development Index (HDI) by Country.” Human Development Reports, 2025, hdr.undp.org/data-center/country-insights#/ranks.
- World Bank. “Agriculture, Forestry, and Fishing, Value Added (% of GDP) [NV.AGR.TOTL.ZS].” World Development Indicators, data.worldbank.org/indicator/NV.AGR.TOTL.ZS.
- World Bank. “Exports of Goods and Services (% of GDP) [NE.EXP.GNFS.ZS].” World Development Indicators, data.worldbank.org/indicator/NE.EXP.GNFS.ZS.
- World Bank. “GDP Growth (Annual %) [NY.GDP.MKTP.KD.ZG].” World Development Indicators, data.worldbank.org/indicator/NY.GDP.MKTP.KD.ZG?locations=CH.
- World Bank. “GDP per Capita, Current US$ [NY.GDP.PCAP.CD] for Switzerland.” World Development Indicators, data.worldbank.org/indicator/NY.GDP.PCAP.CD?locations=CH.
- World Bank. “Gross Capital Formation (% of GDP) [NE.GDI.TOTL.ZS].” World Development Indicators, data.worldbank.org/indicator/NE.GDI.TOTL.ZS.
- World Bank. “Imports of Goods and Services (% of GDP) [NE.IMP.GNFS.ZS].” World Development Indicators, data.worldbank.org/indicator/NE.IMP.GNFS.ZS.
- World Bank. “Industry, Value Added (% of GDP) [NV.IND.TOTL.ZS].” World Development Indicators, data.worldbank.org/indicator/NV.IND.TOTL.ZS.
- World Bank. “Inflation, Consumer Prices (Annual % Growth) – Switzerland.” World Development Indicators, 2025, databank.worldbank.org/reports.aspx?source=2&series=FP.CPI.TOTL.ZG&country=CHE#.
- World Bank. “Research and Development Expenditure (% of GDP) [GB.XPD.RSDV.GD.ZS].” World Development Indicators, data.worldbank.org/indicator/GB.XPD.RSDV.GD.ZS.
- World Bank. “Services, Value Added (% of GDP) [NV.SRV.TOTL.ZS].” World Development Indicators, data.worldbank.org/indicator/NV.SRV.TOTL.ZS.
- World Bank. “Value Added by Sector (% of GDP) – Switzerland.” World Development Indicators, 2025, databank.worldbank.org/reports.aspx?source=2&series=NY.GDP.MKTP.CD&country=CHE#.
Organization for Economic Co-operation and Development, Consumer Price Indices (CPIs, HICPs), COICOP 1999: Consumer Price Index: Total for Switzerland [CHECPIALLMINMEI], retrieved from FRED, Federal Reserve Bank of St. Louis; https://fred.stlouisfed.org/series/CHECPIALLMINMEI, May 10, 2026.
Organization for Economic Co-operation and Development, Consumer Price Indices (CPIs, HICPs), COICOP 1999: Consumer Price Index: Communication for Switzerland [CHECP080000CTGYM], retrieved from FRED, Federal Reserve Bank of St. Louis; https://fred.stlouisfed.org/series/CHECP080000CTGYM, May 10, 2026.