



JAPAN
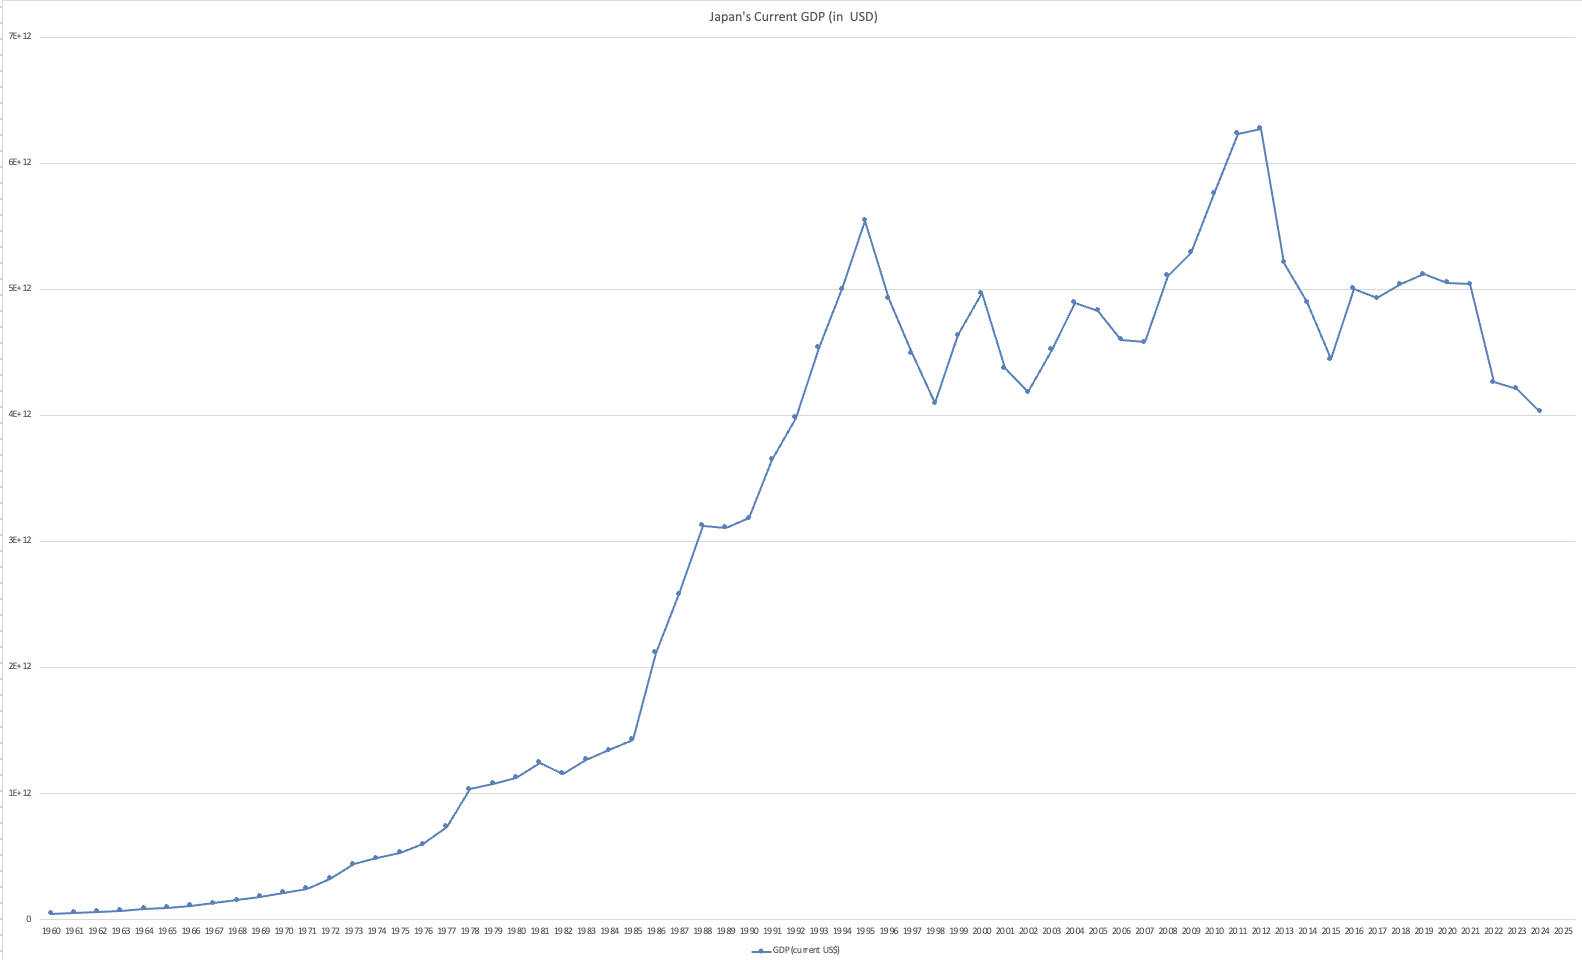
Japan is a wealthy industrialized economy with a GDP of $4.03 trillion as of 2024, which is primarily comprised of consumption followed by investment and government spending. Japan maintains a major global trading economy, balancing a mix of both large imports and exports. This generates enough revenue to offset each other, keeping its overall trade balance stable. In addition to having relatively volatile GDP growth in the past 20 years, a major challenge that Japan faces is the overall shrinking and aging population. This reduces its workforce which consequently slows economic growth. Japan’s economy remains highly developed but faces structural challenges related to demographics.


Macroeconomic Indicators

(Source: World Bank Data, Made in Excel)
Japan’s GDP was very small in the 1960s but grew quickly over the following decades as the country became major in industrials and exports. It reached its peak of around $6.3 trillion in the early 2010s before dropping, mostly because the Japanese yen weakened in value against the US dollar. Despite the drop, Japan’s economy has remained large but with drops, hovering around $4–5 trillion in recent years.
(Source: World Bank Data, Made in Excel)
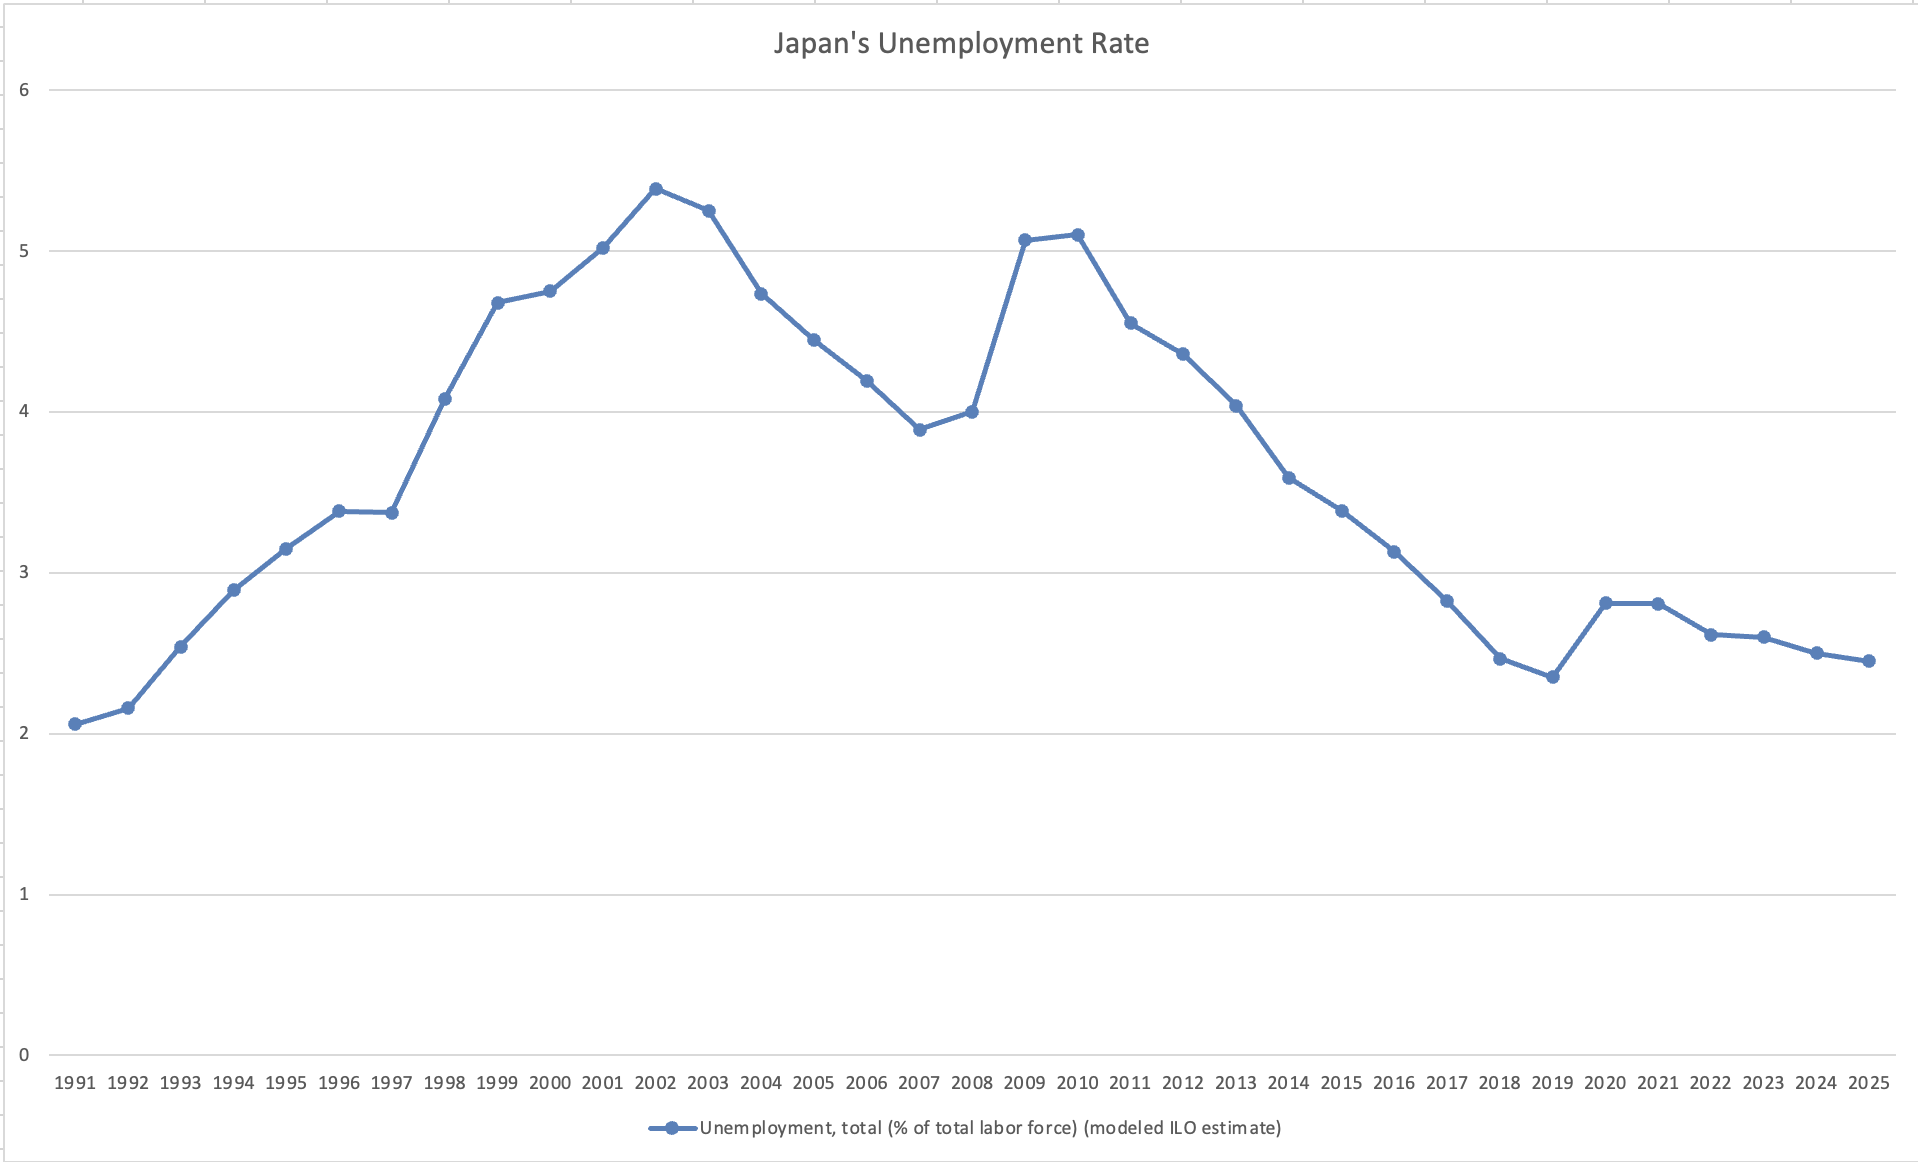
This graph displays Japan’s unemployment rate from the mid 1990s to now. The unemployment rate increased until the early 2000s, reaching a peak of around 5% in 2003. This rise was an outcome of the collapsed asset bubble in the 90s. After this, unemployment declined overall. There was a small increase around 2009- due to the global financial crisis- but the rate continued to decline shortly after. Since the mid-2010s, Japan has maintained low unemployment, close to 2%, reflecting a stable labor market and a shrinking labor force.
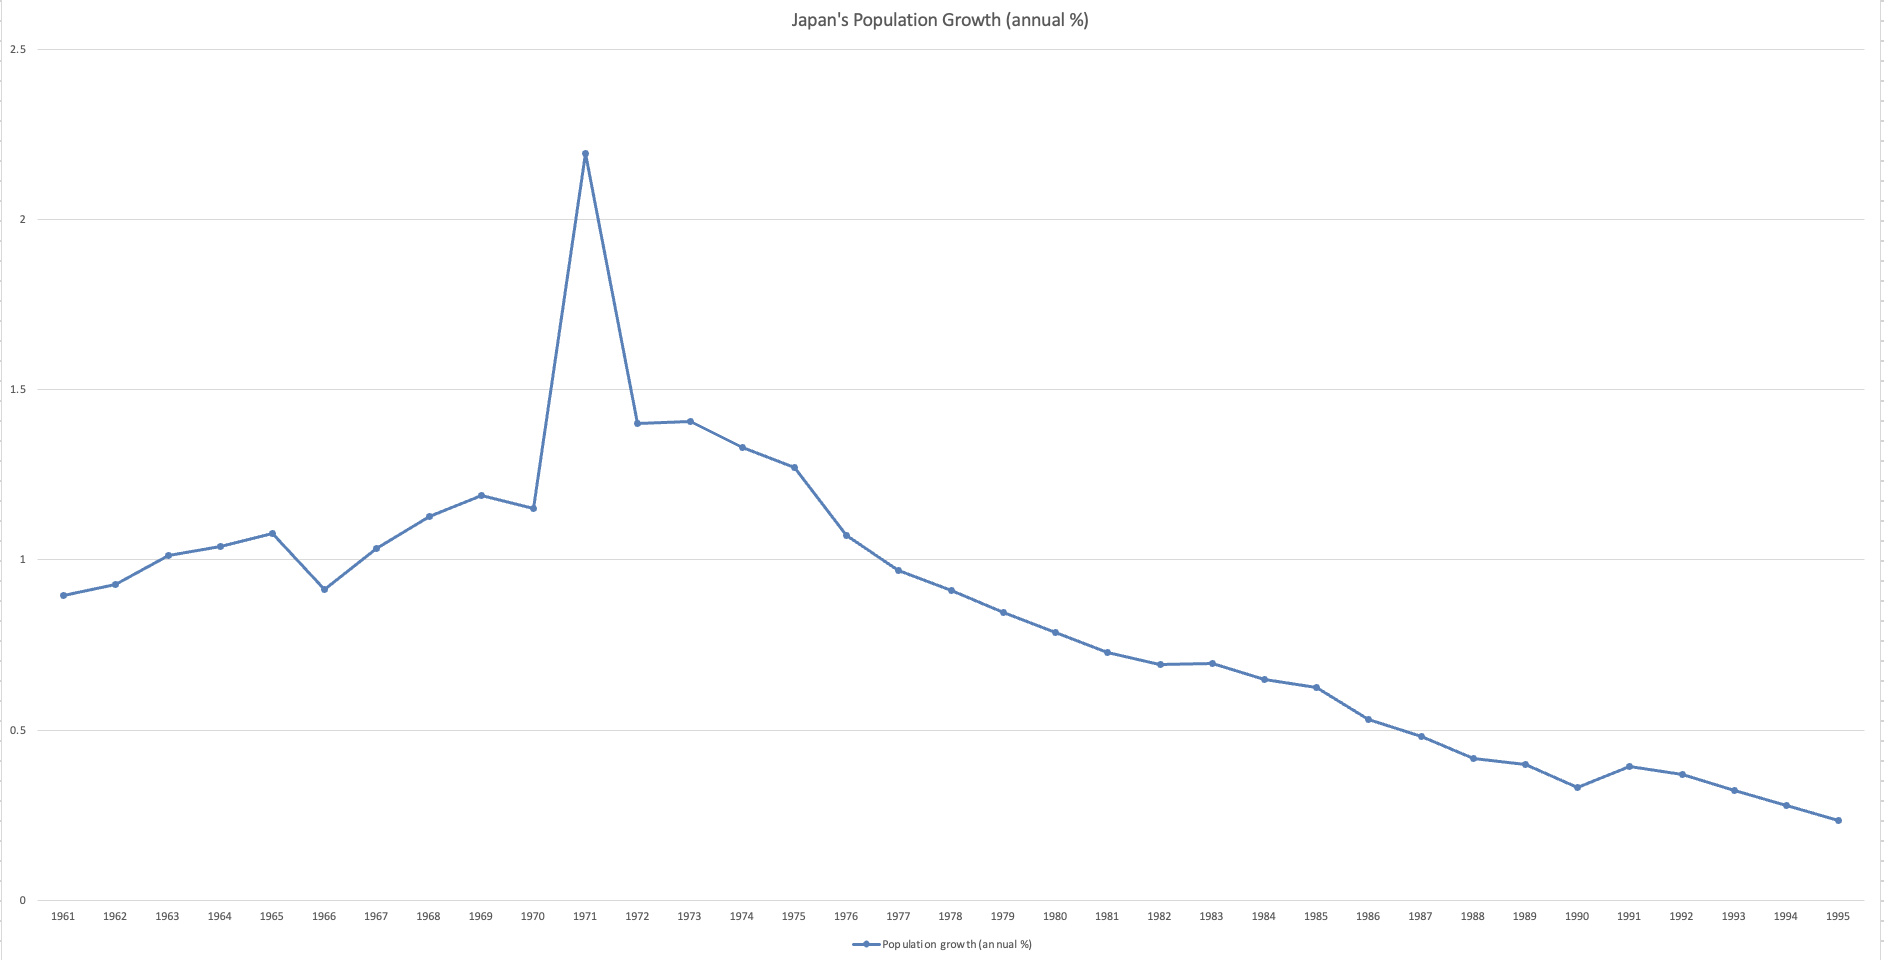
(Source: World Bank Data, Made in Excel)
This graph depicts the percent change in the population of Japan from 1961 to 2024. The overall trend is downwards with population growth falling from 0.9% in 1961 to -0.4% in 2024. The largest percentage decrease in population being -0.5% in 2021 and 2023, and the largest percentage increase being a relatively extreme outlier at 2.2% in 1971. This trend reflects the declining birth rates and overall population of Japan, which poses demographic challenges for the future economic health of the country.
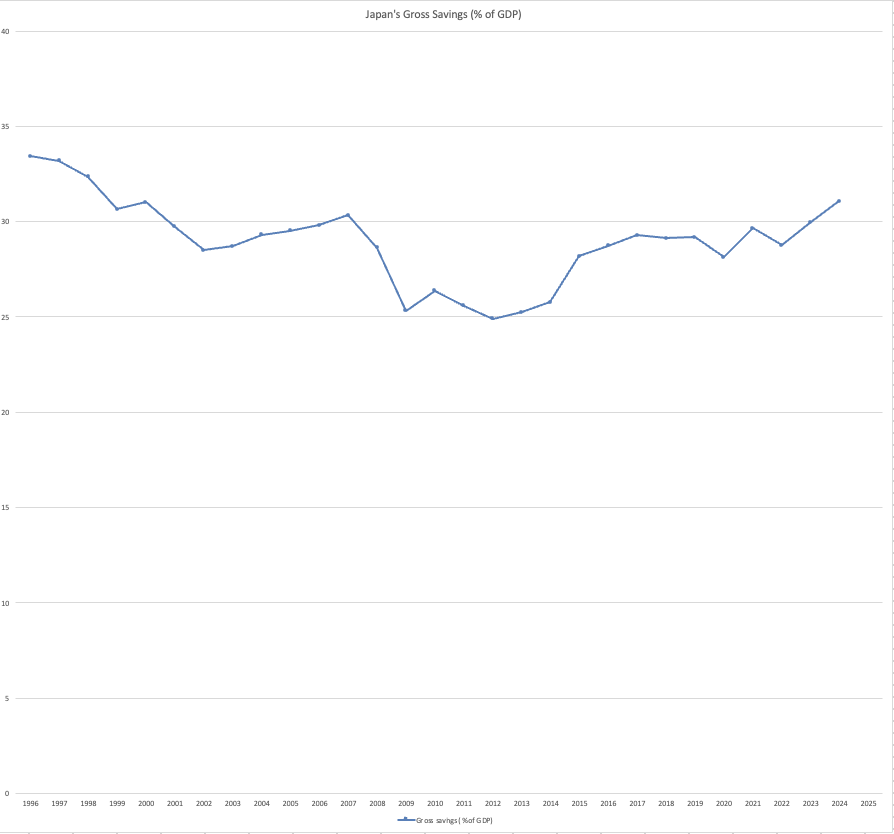
(Source: World Bank Data, Made in Excel)
This graph displays the overall savings trend for Japan from 1996 – 2024. Savings began to decline steadily following the asset bubble burst in the 1990s and an aging population, reaching 29% in 2002. An export-led boom briefly recovered the savings rate to around 30% before plummeting to 25% following the global financial housing crisis of 2008 and the spike in energy imports caused by natural disasters. Since then, the savings rate has been gradually increasing, reaching 31% in 2024.
AD-AS Analysis of Two Policies
Policy #1: Monetary Response: Reduction in Interest Rates
In 2016, the Bank of Japan set interest rates below zero. The goal was to get banks to lend more money, ultimately getting people and businesses to spend more. This happened when Japan had slow economic growth and very low inflation. This policy mainly affects aggregate demand as it tries to increase spending and investment.
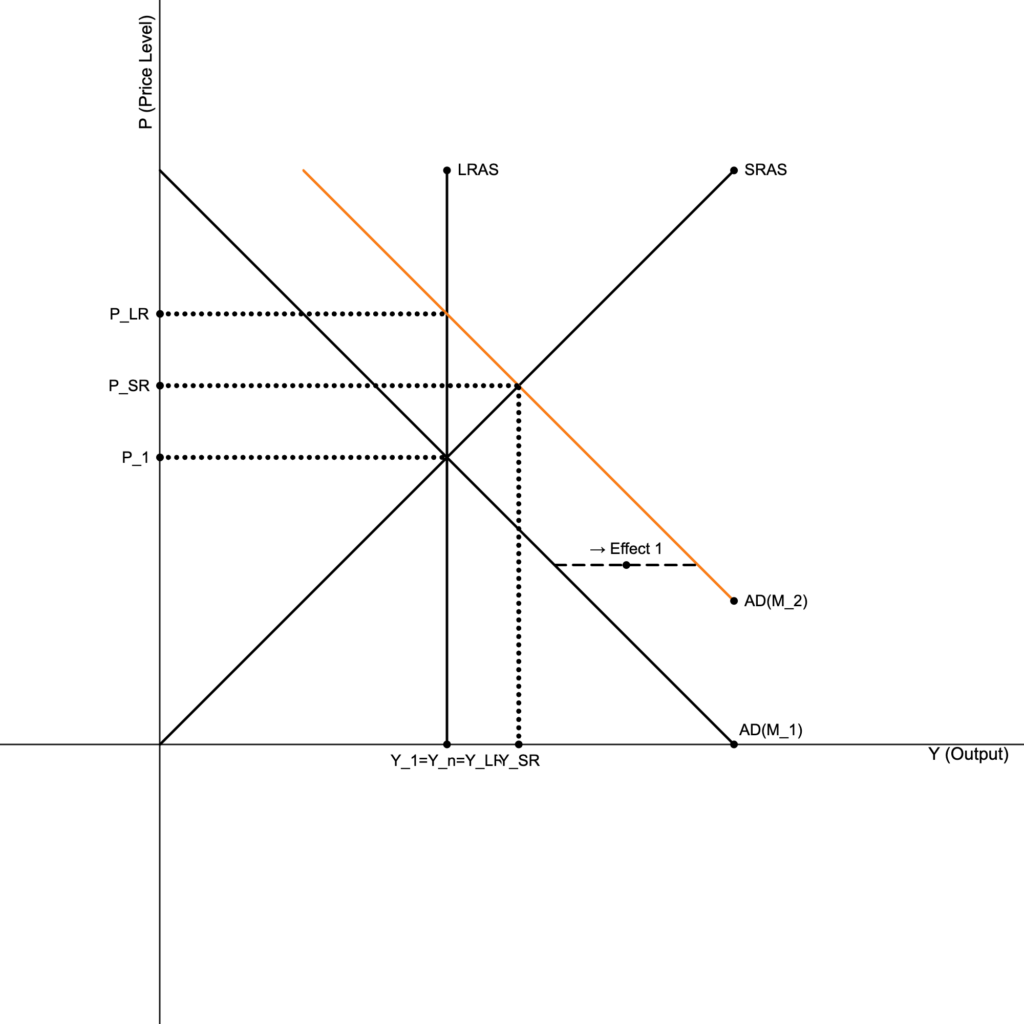
● The increase in the money supply results in a rightward shift in the AD curve, depicted in effect 1.
● In the short-run the price level rises from P_1 to P_SR, and output rises to Y_SR from Y_1.
● In the long-run the price level rises again and permanently to P_LR, and output falls back down to P_1, which is equal to P_LR and P_n, from P_SR.
● The effects in the short-run are an increase in output and price level.
● The effects in the long-run are a further increase in price level compared to the short-run and a reversion to the previous long-run output.
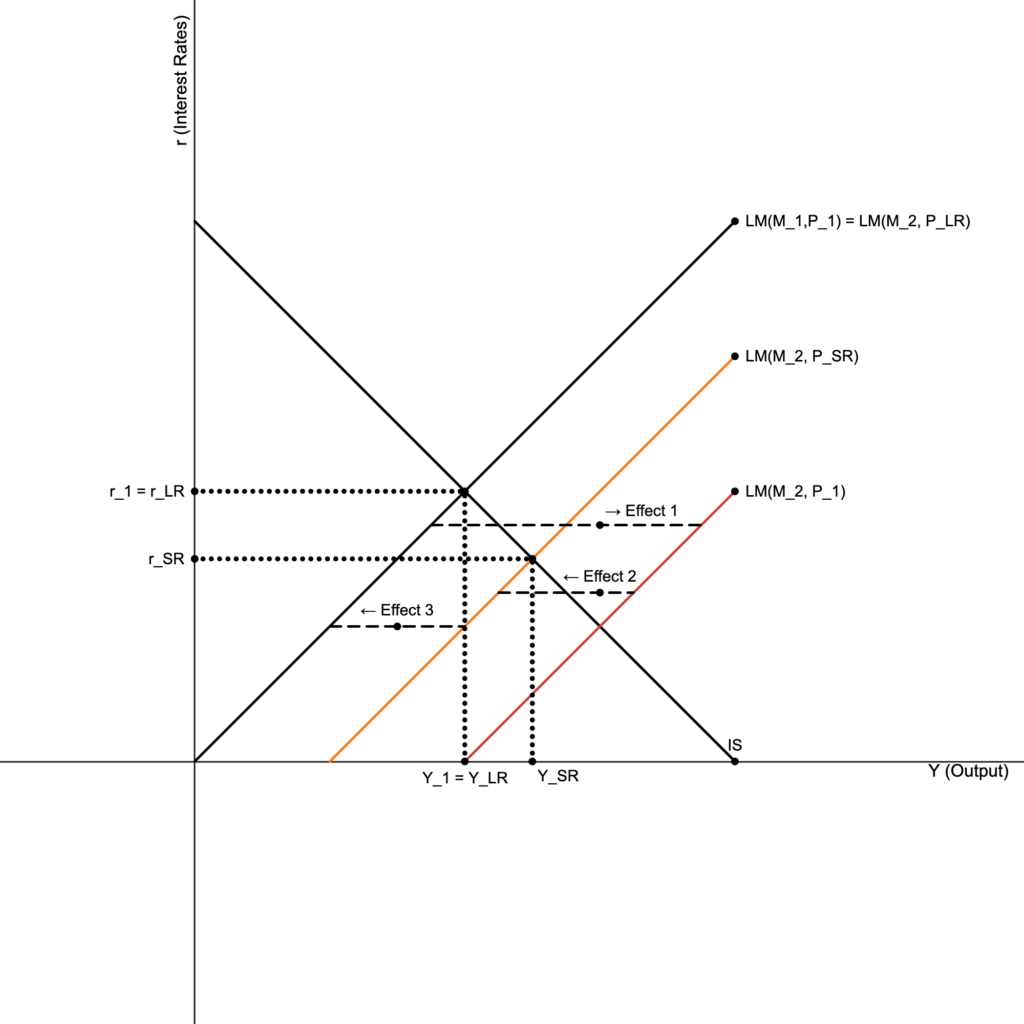
● The increase in the money supply results in a shift in the LM curve from LM(M_1, P_1) to LM(M_2, P_1), which is noted by effect 1.
● However LM(M_2, P_1) does not account for the increase in price level from P_1 to P_SR in the short-run.
● The effect of the shift in price level from P_1 to P_SR is accounted for by the inward shift of the LM curve from LM(M_2, P_1) to LM(M_2, P_SR), which is noted by effect 2.
● In the long-run the price level rises again from P_SR to P_LR which causes another inward shift in the LM curve from LM(M_2, P_SR) to LM(M_2, P_LR) where LM(M_2, P_LR) is at the same position as LM(M_1, P_1), which is noted by effect 3.
● In the short run interest rates fall to r_SR, and in the Long run they rise from r_SR to r_LR, which is equal to r_1.
● Investment increases in the short run as a result of lower interest rates in the short_run. In the long-run investment remains static since the r_1 and r_LR are equal.
● In the short-run consumption increases as a result of both output being higher and interest rates lower in the short-run compared to the previous equilibrium. In the long-run consumption falls back to the previous equilibrium level since the long run output and interest rates are equal to the previous equilibrium levels.
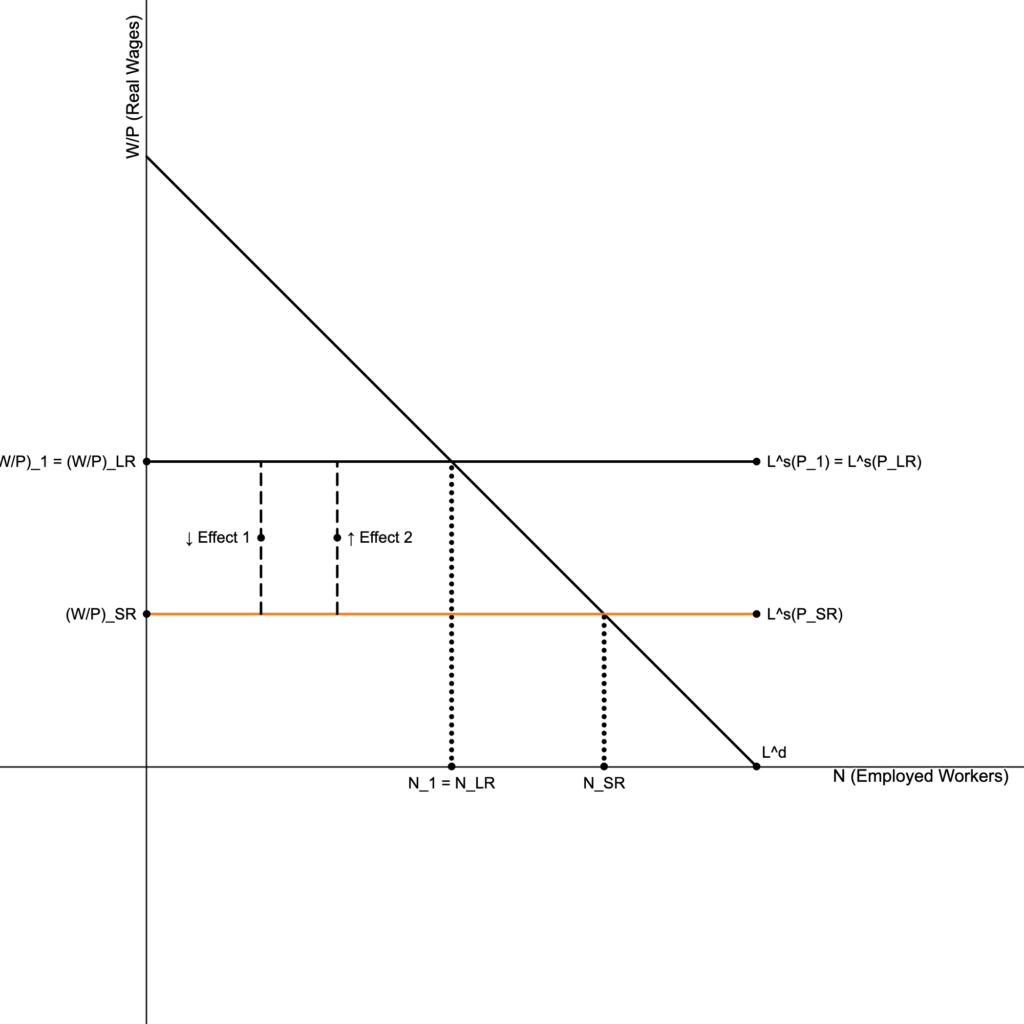
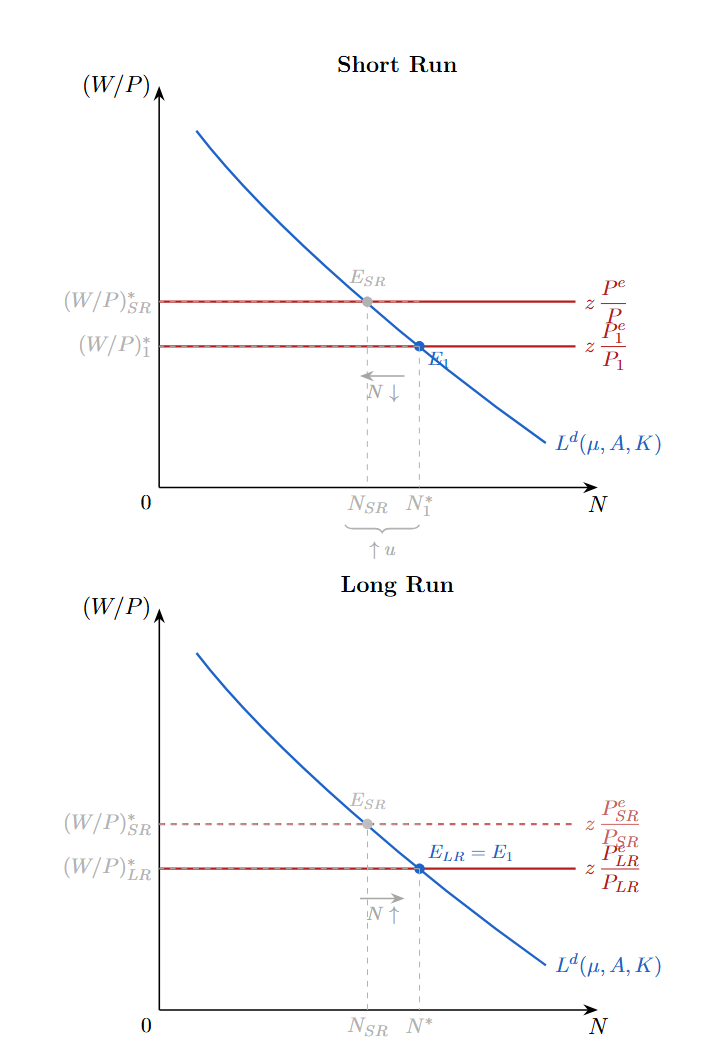
● The increase in price level from P_1 to P_SR in the short-run will result in a downward shift in the L^s curve from L^s(P_1) to L^s(P_SR), which is noted in effect 1, since the supply of labor is determined by the expected price level divided by the actual price level.
● In the long-run the L^s curve shift back up to its previous long-run equilibrium level of L^s(P_1), which is equal to L^s(P_LR), from L^s(P_SR) despite the further increase in price level in the long-run because in the long-run the expected price level and the actual price level are equal. Put another way, the change in price level can only affect the supply of labor in the short-run because in the long-run there is no difference in the expected price level and the actual price level. This shift back up is noted by effect 2.
● In the short-run the number of employed workers increases from N_1 to N_SR as a result of the high price level, however in the long-run the number of employed workers falls down to N_LR, which is equal to N_1.
● In the Short-run wages fall from (W/P)_1 to (W/P)_SR, and in the long-run they rise again to (W/P)_LR, which is equal to the previous equilibrium level of (W/P)_1.
Following the Bank of Japan’s shift to negative interest rates in January 2016, real-world data only partially aligned with AD–AS model predictions. On the labor market side, outcomes matched the model well as unemployment fell steadily from 3.39% in 2015 to 2.47% by 2018, consistent with the predicted short-run increase in employment. GDP growth also showed a modest lagged recovery, rising to 1.7% in 2017 after 0.8% in 2016, offering some support for the model’s short-run output prediction. However, the inflation response was the clearest deviation from theory. Rather than rising, CPI remained near zero or slightly negative in 2016 and reached only 0.5% in 2017. Overall, employment and output moved in the predicted direction but there was an absence of any meaningful inflationary response which shows that the real economy did not behave as cleanly as the AD–AS model forecasts.
In real life, the policy did not work as well as the model predicts. One reason is that Japan has an aging population, so older people typically save more and spend less. Also, banks did not want to lend as much as expected. People were unsure about the future, so they chose not to spend more. These things are not fully shown in the AD–AS model, which helps explain why growth and inflation stayed low.
Policy #2: Fiscal Policy during 2019: Consumption Tax Increase to 10%
In 2019, Japan raised its consumption tax from 8% to 10% with the goal of paying for government debt and costs from an aging population. This happened during a time of slow economic growth. Higher taxes made people spend less money. This policy mainly affects aggregate demand because it reduces consumer spending.
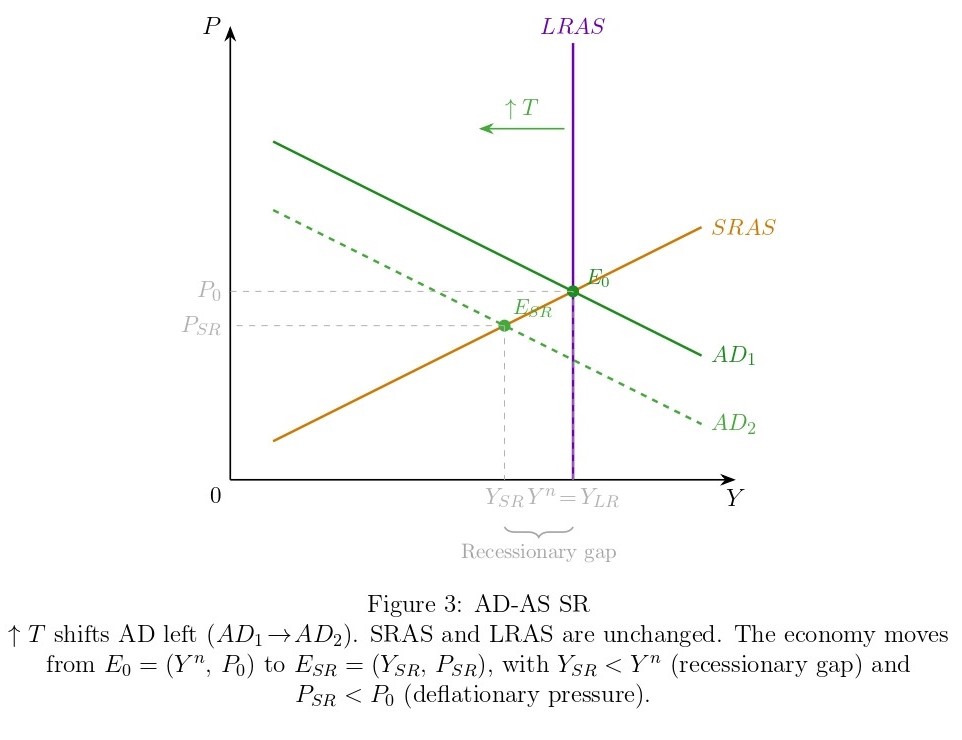
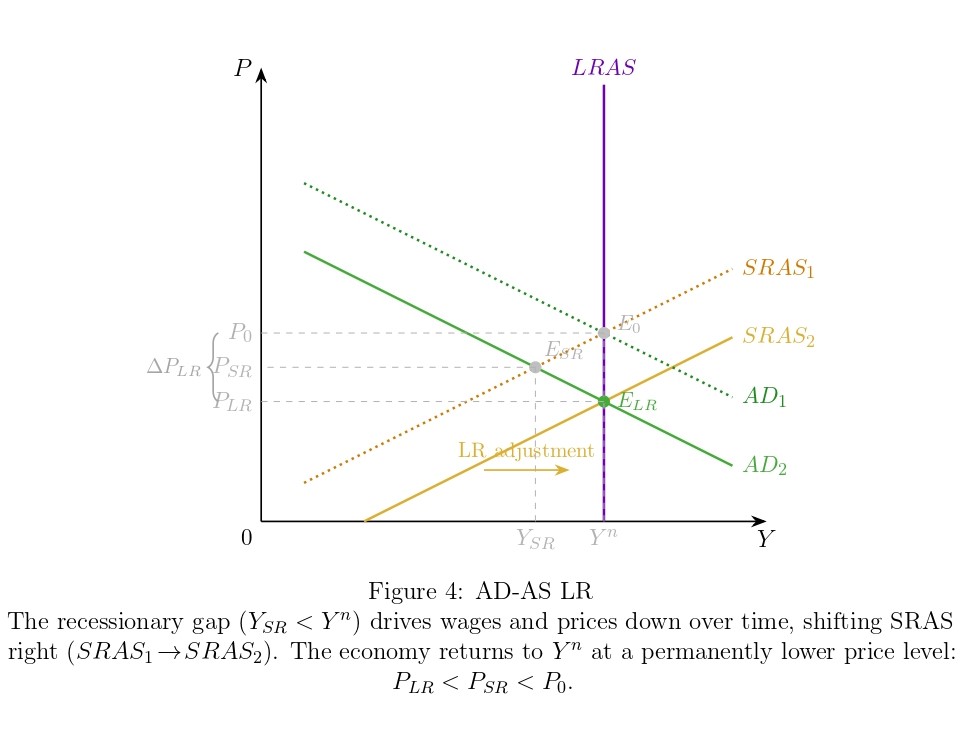
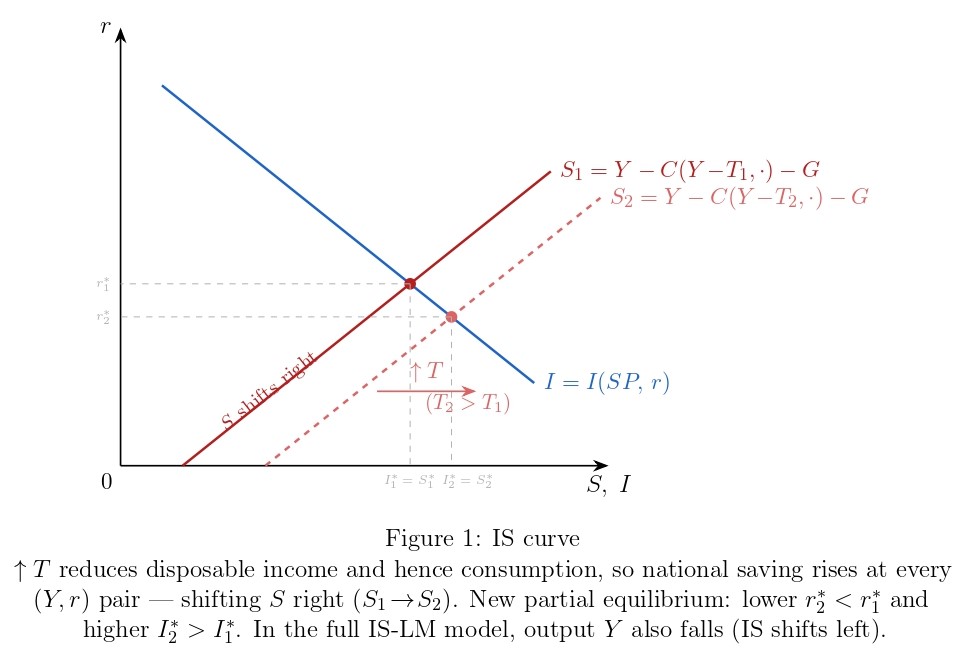
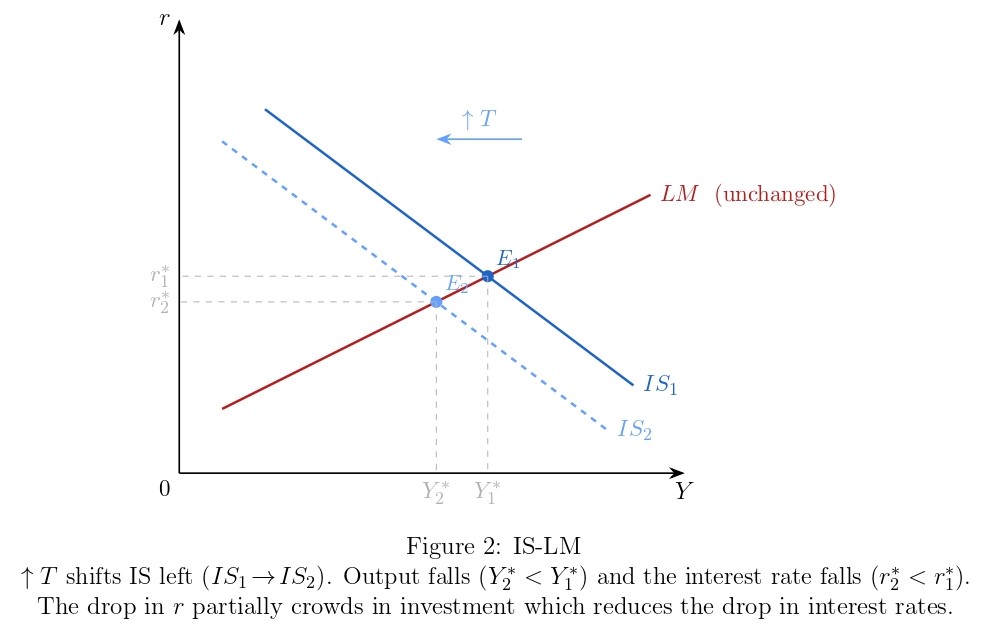
The real-world outcomes following the October 2019 consumption tax hike were largely consistent with the AD–AS model’s predictions. The model predicts a leftward AD shift causing a short-run drop in output and deflationary pressure, and this is what the data shows as GDP growth fell to approximately −0.4% in 2019 and then contracted sharply by −4.2% in 2020. Inflation also weakened, dropping from 1.0% in 2018 to 0.5% in 2019, consistent with the model’s prediction. Unemployment held relatively steady at 2.35% through 2019 before rising up to 2.81% in 2020. Overall, the consumption tax hike produced outcomes that aligned well with the AD–AS framework as output fell, deflationary pressure emerged, and labor market slack increased.
The results were mostly what the model predicted. Economic growth slowed and people spent less; however, some other factors were significant. The government added short-term spending to help the economy, which reduced the negative effect. Also, global economic conditions affected Japan in parallel. The AD–AS model shows the main idea, but it does not include these extra factors.
Asset Price Bubble Burst (1991)
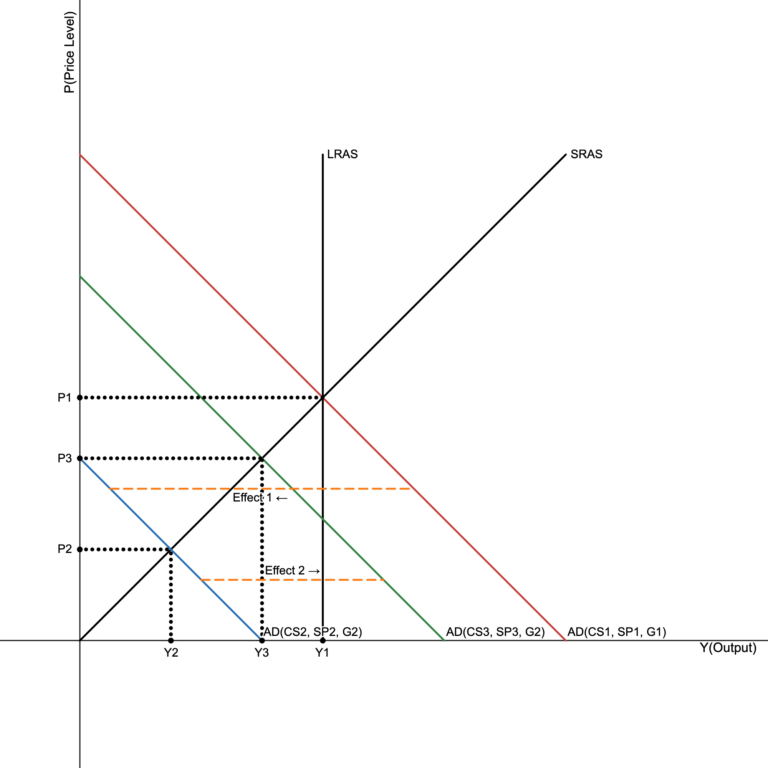
While there have been many notable macroeconomic events in Japanese history, an extreme example is the recessions of the 1990s known as the lost decade, which were initially caused by the bursting of the asset price bubble in 1991, following the extraordinary economic growth of the 1980s. The recessions persisted through the 1990s, with the exceptions of a brief reprieve in 1995-6, despite fiscal and monetary policy interventions, and included the worst economic downturn for Japan since the second world war. The asset bubble that kicked off the recessions existed from approximately 1986 to 1991 and consisted of the overvaluing of real estate and the Japanese stock market, stemming from overheating in the Japanese economy during the late 1980s. The bubble burst as a result of tightening monetary policy by Japan’s central bank in an effort to curb speculation, leading to a collapse of equity and land prices.
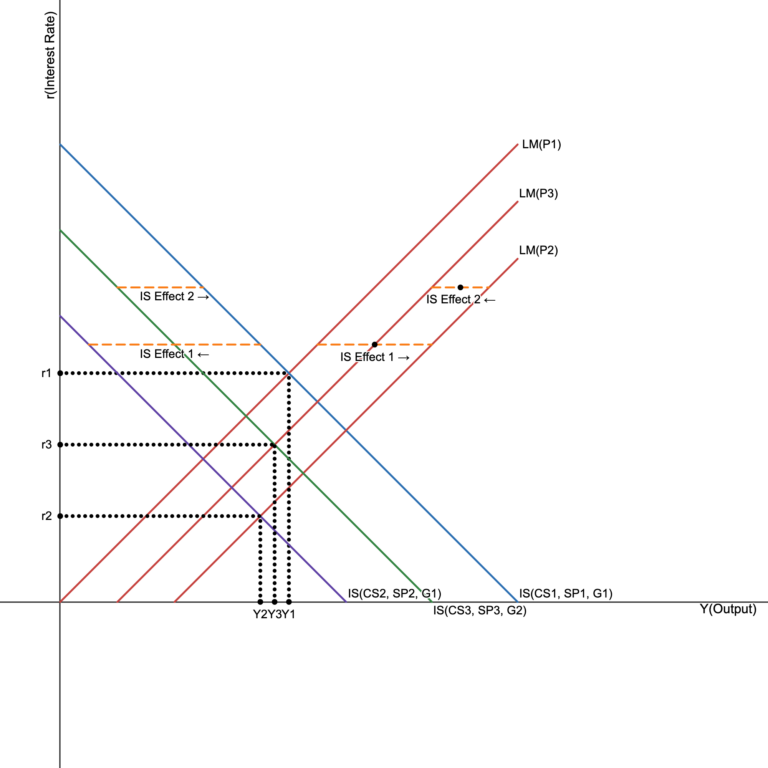
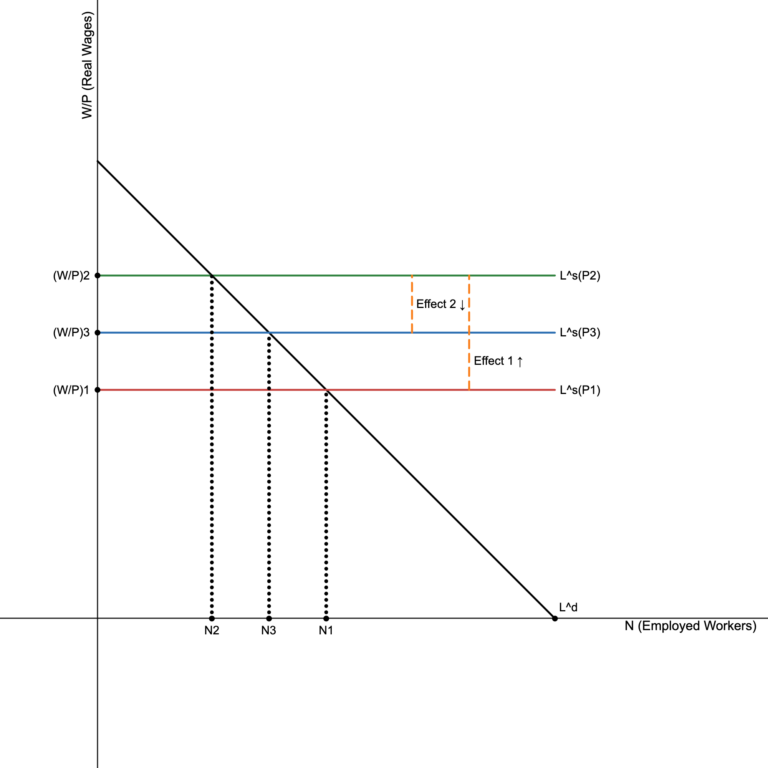
In the aftermath of the collapsed asset price bubble, Japanese GDP growth, and consequently output, decreased eventually going negative at several points, inflation fell eventually going negative, and unemployment rose throughout the decade. The immediate effects of the shock consisted of severe losses for those holding stocks and decreased wealth for those holding property. These losses and fear of future instability in the economy led to a pronounced decrease in consumer sentiment and animal spirits, which had the effect of shifting Japanese aggregate demand inward, thus decreasing output, price level, consumption, investment, and employment throughout the Japanese economy.
By 1999 the Japanese economy began to recover as a result of strong fiscal policy in the form of increased public investment spending and decisive intervention to stabilize the faltering banking sector. The fiscal policy worked by directly increasing government spending, shifting aggregate demand out, and by reassuring consumers and investors of the stability of the financial sector, resulting in increased consumer sentiment leading to additional outward movement of aggregate demand. While these policies pulled the Japanese economy out of the worst of the recession, going forward GDP and GDP growth were broadly stagnant with inflation remaining low or even negative going into the early 21st century, with recovery still ongoing.
This graph depicts the economic shifts resulting from the collapse of the asset price bubble in the AD-AS model. It illustrates the inward shift of aggregate demand, the resulting decrease in output and price level, and the eventual partial recovery in effect two of aggregate demand shifting out.
This graph depicts the effects of the bursting of and eventual recovery from the asset price bubble on the IS-LM model. It demonstrates the decrease in output as a result of the inward shift in the IS curve and its interaction with the outward shift of the LM curve, while also showing shifts in both curves during the recovery.
This graph depicts the consequences of the collapsed asset price level on the labor market using the labor market model. It demonstrates the upward shift in the labor supply curve, which results in higher unemployment, and the shift back down during the recovery where unemployment came more under control. Notably this depiction of the model does not have the market go into long-run equilibrium, where we would expect the labor supply curve to shift all the way down to L^s(P1), and instead highlights the effects of recovery policy on the labor market.
Economic Growth
Drivers of economic growth
Capital accumulation
In the 1980s, Japan experienced rapid capital accumulation driven by an asset price bubble (1986-1991), where stock and real estate prices were greatly inflated by aggressive monetary easing. This led to over-investment that was often unproductive, creating excess capacity rather than real growth. Following the bubble burst in 1992, capital accumulation slowed down significantly as banks and firms focused on improving their financial health to address bad debt and high leverage. By early 2026, Japan witnessed a wealth restructuring. Households are shifting from decades–long savings culture toward an investment culture, driven by improved NISA accounts and a transition from deflation to inflation.
Labor force growth and human capital
The working-age population peaked in 1995 and has been shrinking ever since. In the 1980s, labor growth was stable and tight. And by the 2000s, it became a major drag for growth. The traditional lifetime employment and seniority based wage systems of the 1980s began to erode as firms sought flexibility through non-regular workers. Since 2012, rising participation from women and seniors has mitigated the shrinking population. By 2025-2026, the focus was shifted towards reskilling, with the government introducing financial support for sabbatical-style training and four-day work weeks to modernize human capital for an AI-driven economy.
Productivity and technological change
Japan’s productivity growth has historically been high in the manufacturing sector but stagnant in services. In the 1990s and 2000s, Japan’s investment in information technology remained surprisingly limited outside of electrical machinery. As of late, Japan is now aggressively adopting AI to solve productivity challenges in a shrinking workforce.
Structural transformation across sectors
Japan has experienced a shift away from manufacturing as its economy matured. The share of manufacturing in nominal GDP fell to approximately 22% by the early 2000s. Structural shifts are factoring new areas such as infrastructure (rebuilding the networks built during the 1970-80s high growth era), cultural exports (market for anime and VTubers), and shipbuilding (due to geopolitical shift).
Institutional and Policy changes
The 1980s bank-centric and cross-shareholding model were reformed in 2013 (Abenomics). And through 2026 have shifted Japan toward a shareholder-oriented, increasing external directors and institutional shareholder influence. The policies of Abenomics targeted deflation through aggressive monetary easing. By 2026, the economy has finally transitioned to persistent inflation, which is fundamentally reshaping consumption and investment patterns.
Overall Interpretation
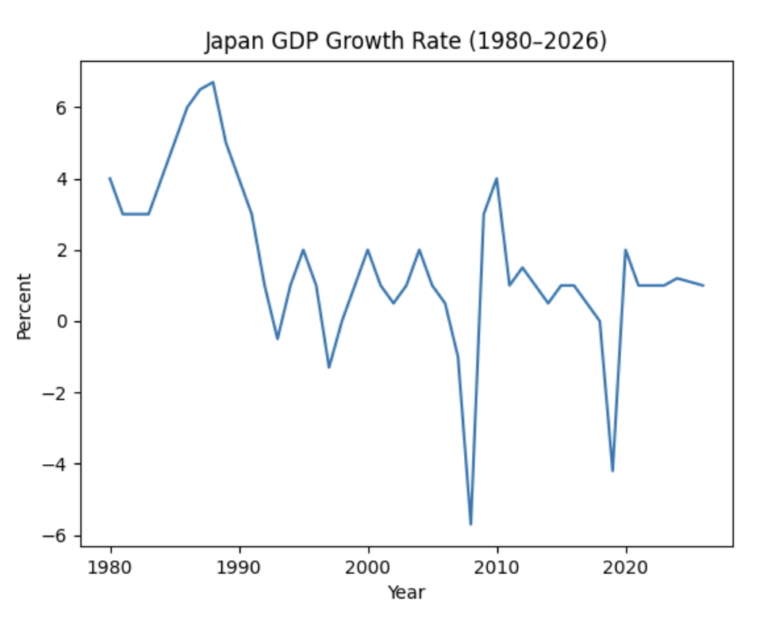
Japan’s economic growth pattern shows a clear break around the early 1990s. Before the asset price bubble burst, Japan experienced strong GDP and GDP per capita growth. After the bubble collapsed, weaker investment, banking problems, and slower labor force growth contributed to decades of lower growth. Later shocks, including the global financial crisis and COVID-19, created additional declines.
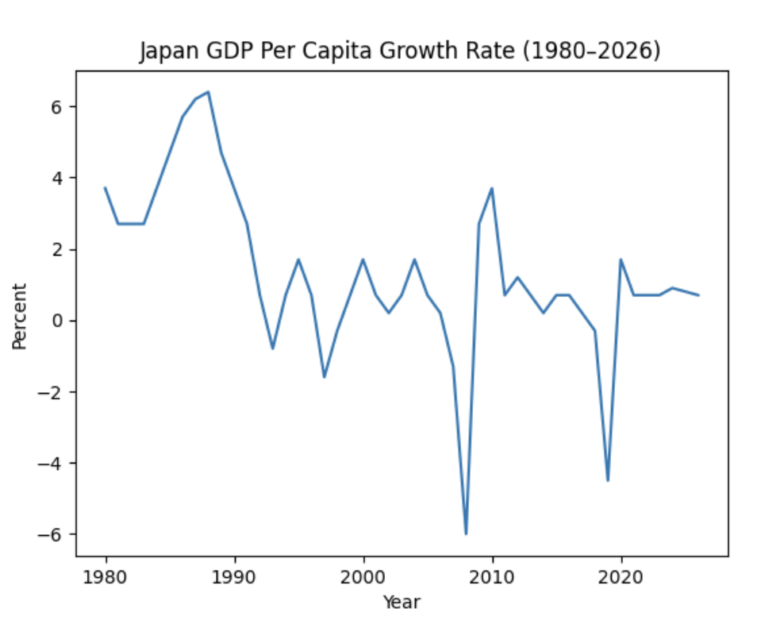
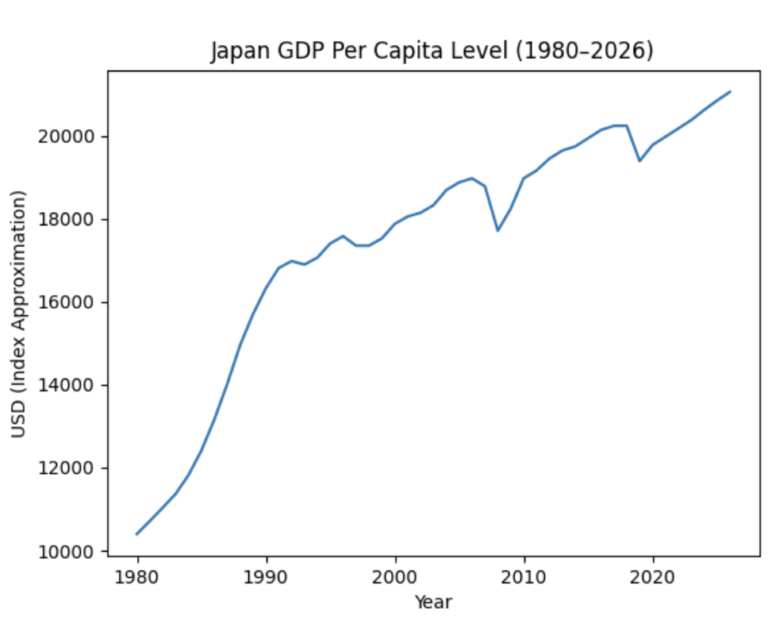
These graphs show Japan’s long-run economic growth patterns from 1980 through 2026. Together, they highlight the shift from strong growth in the 1980s to slower growth and stagnation after the collapse of the asset price bubble in the early 1990s.
This graph shows Japan’s transition from strong growth in the 1980s to long-term stagnation after the 1990 asset bubble collapse. Major declines in 1998, 2009, and 2020 reflect global and domestic shocks.
GDP per capita growth closely follows overall GDP growth, showing that individual living standards also slowed significantly after the 1990s. This supports the idea that Japan’s stagnation affected both total output and income per person.
This graph highlights Japan’s rapid rise in income levels before 1990 and the flattening trend afterward. The slower increase after the bubble collapse illustrates Japan’s long-term economic stagnation.
Sources:
- Arikawa, Y., Miyajima, H., & Saito, T. (2025). Overview of the evolution of corporate governance: The impact of reforms and the future of Japanese firms (RIETI Policy Discussion Paper Series 25-P-014). Research Institute of Economy, Trade and Industry. https://www.rieti.go.jp/jp/publications/pdp/25p014.pdf
Bayoumi, T., & Collyns, C. (2000). Post Bubble Blues–How Japan Responded to Asset Price Collapse. International Monetary Fund. https://www.imf.org/external/pubs/nft/2000/bubble/#over
- Columbia Threadneedle Investments. (n.d.). The early innings: Why Japan’s structural story has years to run. https://www.columbiathreadneedleus.com/insights/latest-insights/the-early-innings-why-japans-structural-story-has-years-to-run
Federal Reserve Bank of St. Louis. 1994-2025. Real GDP and Its Components, Quarterly, Seasonally Adjusted. Federal Reserve Bank of St. Louis. https://fred.stlouisfed.org/release/tables?rid=269&eid=155790#snid=155791. (accessed February 21, 2026).
Fukao, K. (2010). Service sector productivity in Japan: The key to future economic growth (RIETI Policy Discussion Paper Series 10-P-007). Research Institute of Economy, Trade and Industry. https://www.rieti.go.jp/jp/publications/pdp/10p007.pdf
- International Monetary Fund. (2015). Japan’s growth challenge: Needs and potential. In Can Abenomics succeed? (Ch. 6). International Monetary Fund. https://www.elibrary.imf.org/display/book/9781498324687/ch006.xml
International Monetary Fund. (2026) GDP, current prices. International Monetary Fund. https://www.imf.org/external/datamapper/NGDPD@WEO/JPN?zoom=JPN&highlight=JPN
- Hausman, J. K., & Wieland, J. F. (2014). Abenomics: An update. Brookings Institution. https://www.brookings.edu/articles/abenomics-an-update/
- OECD. (2025). AI use in the Japanese workplace. In Artificial intelligence and the labour market in Japan. OECD Publishing. https://www.oecd.org/en/publications/artificial-intelligence-and-the-labour-market-in-japan_b825563e-en/full-report/ai-use-in-the-japanese-workplace_faf178d2.html
Organization for Economic Co-operation and Development, Infra-Annual Labor Statistics: Unemployment Rate Total: From 15 to 64 Years for Japan [LRUN64TTJPM156S], retrieved from FRED, Federal Reserve Bank of St. Louis; https://fred.stlouisfed.org/series/LRUN64TTJPM156S, May 1, 2026.
- Research Institute of Economy, Trade and Industry. (n.d.). The structural causes of Japan’s “Two lost decades” (Research Digest No. 03). https://www.rieti.go.jp/en/publications/rd/003.html
World Bank Group. 1961-2024. Population growth (annual %) – Japan. World Bank Group. https://data.worldbank.org/indicator/SP.POP.GROW?locations=JP. (accessed February 21, 2026).
World Bank Group. 1991-2024. Unemployment, total (% of total labor force) (modeled ILO estimate) – Japan. World Bank Group. https://data.worldbank.org/indicator/SL.UEM.TOTL.ZS?locations=JP. (accessed February 21, 2026).
World Bank Group. 1996-2024. Gross savings (% of GDP) – Japan. World Bank Group.https://data.worldbank.org/indicator/NY.GNS.ICTR.ZS?locations=JP. (accessed February 21, 2026).
World Bank Group. (2026) GDP growth (annual %) – Japan. World Bank Group. https://data.worldbank.org/indicator/NY.GDP.MKTP.KD.ZG?locations=JP
World Bank Group. 1960-2024. GDP (current US$) – Japan. World Bank Group. https://data.worldbank.org/indicator/NY.GDP.MKTP.CD?locations=JP. (accessed February 21, 2026).
World Bank Group (2026). Inflation, consumer prices (annual %) – Japan. World Bank Group. https://data.worldbank.org/indicator/FP.CPI.TOTL.ZG?locations=JPa