


An increase in government spending shifts the aggregate demand (AD) curve to the right. In the short run, this leads to higher output and a higher price level as firms respond to increased demand. This movement from point A to point B reflects economic expansion. However, in the long run, higher prices lead to higher wages and production costs, shifting the short-run aggregate supply (SRAS) curve to the left. As a result, the economy returns to its natural level of output at point C, but with a permanently higher price level. This shows that expansionary fiscal policy increases output in the short run, while in the long run, it primarily leads to inflation. 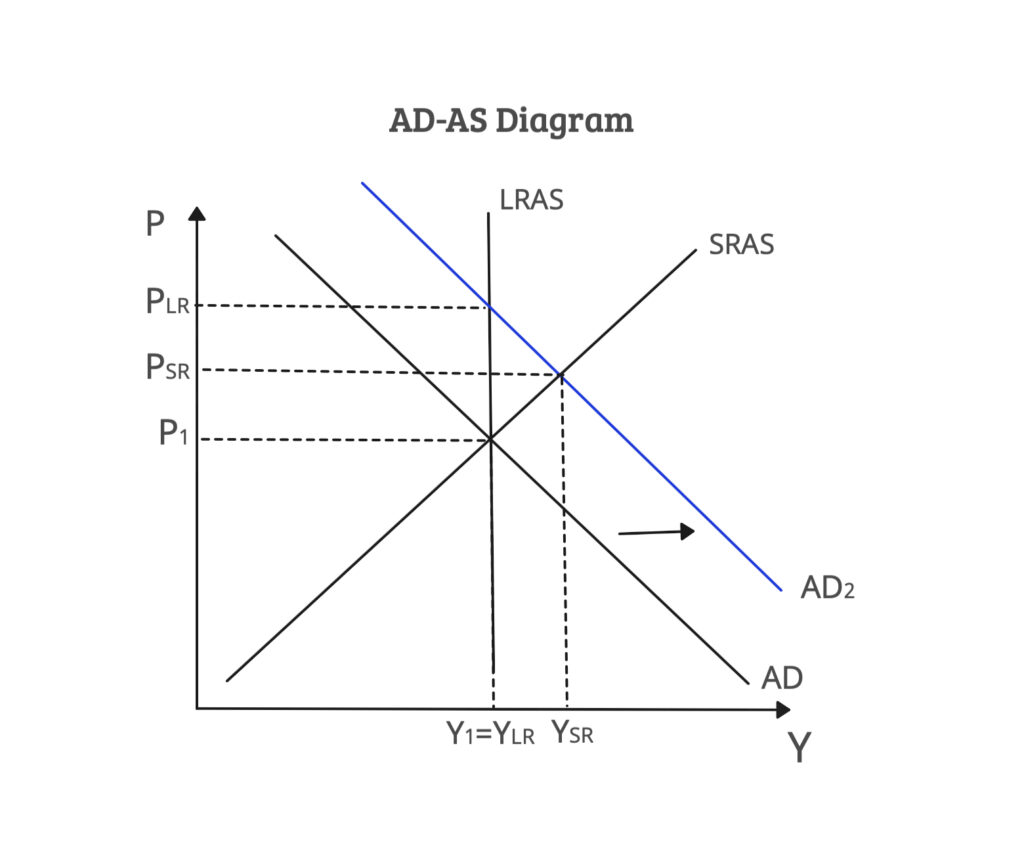
The increase in government spending shifts the IS curve to the right, reflecting higher demand in the goods market due to expansionary fiscal policy. In the short run, this leads to higher output and a higher interest rate as increased income raises the demand for money. At the same time, the rise in the price level reduces the real money supply, causing the LM curve to shift left. In the long run, as prices increase further, the real money supply declines, leading to an additional leftward shift of the LM curve. As a result, interest rates rise further, and output returns to its original level. Overall, the IS–LM model shows that while fiscal expansion increases output in the short run, rising prices lead to higher interest rates. 
In the short run, an increase in government spending raises the price level while expected prices are still unchanged. Since labor supply depends on the real wage, the rise in actual prices reduces the real wage. As a result, workers are willing to supply less labor at any given wage, causing the labor supply curve to shift down. At the same time, higher output increases firms’ demand for labor, leading to a temporary rise in employment. In the long run, workers adjust their expectations so that expected prices increase along with actual prices. This restores the real wage and shifts the labor supply curve back to its original position. 
Comparison to real-world outcomes
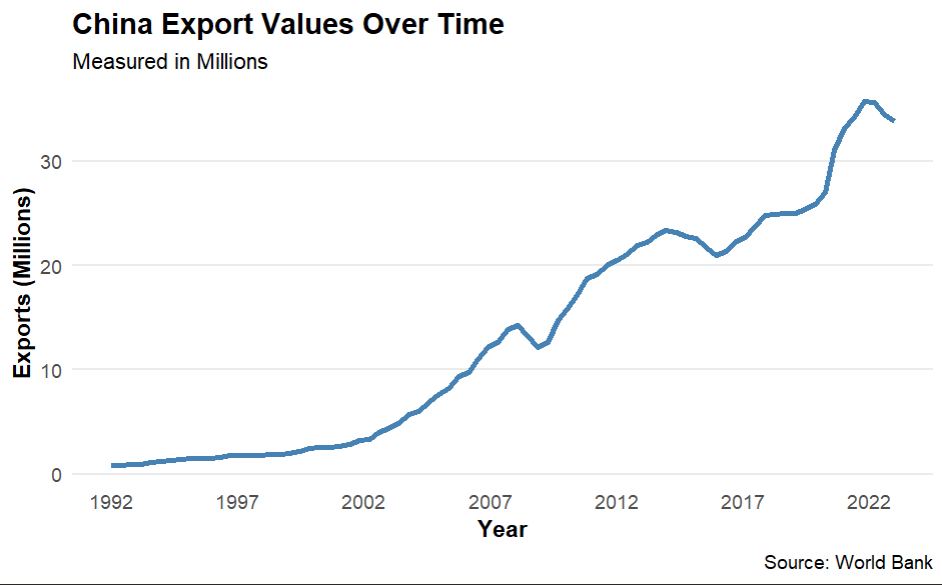
China’s GDP growth slowed sharply in late 2008 and 2009 as a result of the 2008 housing crisis in the US. The impact of this recession was felt worldwide, and China was no different. Under the stimulus policy, GDP grew from around 6% to 8.7%, as the AD-AS graph suggested.
The inflation in China based on the IS-LM model predicts that there would be a rise in inflation for China in both the long and short run. This graph of the CPI doesn’t quite show exactly that. However, instead of immediate inflation spikes, it was slightly delayed and didn’t hit until 2010.

The labor market recovered as expected. By 2010, the demand for labor had been restabilized by the stimulus. As the labor market model had anticipated, the demand for labor rose, which led to a temporary increase in employment.
One discrepancy China faced was deflation despite the stimulus. The stimulus should have theoretically raised inflation, but instead deflation occurred. This was likely caused by the massive demand shock resulting from the global financial crisis. A second factor is that the stimulus was implemented gradually, so its full effect was felt over time rather than all at once, as the model might suggest.
A key limitation of the AD-AS framework is that it treats policy changes as immediate shocks to a closed economy. In reality, the stimulus was phased in over two years, and several external factors were simultaneously at play — none of which the model accounts for.
In response to the 2008 global financial crisis, China shifted to a moderately loose monetary policy to maintain stability and support economic growth. This policy involved a series of aggressive interest rate cuts, causing rates to fall from 7.47% to 5.31%. Furthermore, the required reserve ratio was lowered three times, from 17.5% to 15.5%, in an effort to boost lending. These interventions were aimed at countering the sharp decline in external demand. The policy primarily targeted aggregate demand by stimulating investment and consumption.

The monetary easing lowered interest rates, which reduced the cost of borrowing and encouraged investment and consumption. This increased aggregate demand, shifting the AD curve right to AD2. In the short run, the economy moves from A to B — output rises above the natural level (Y1 to YSR) and the price level increases from P1 to PSR. In the long run, workers adjust their wage expectations upward in response to higher prices, causing SRAS to shift left. The economy returns to its natural output level at C, but with a permanently higher price level at PLR.

The reduction in the reserve requirement ratio and the cuts to the benchmark lending rate expanded the money supply, shifting the LM curve right to LM2. With more money in circulation, the interest rate falls from r1 to r2, which stimulates investment and raises output from Y1 to Y2, moving the equilibrium from A to B. The IS curve itself does not shift — monetary easing works through the money market, not directly through the goods market.

The monetary easing raised aggregate demand and the price level, but nominal wages were slow to adjust. This caused the real wage (W/P) to fall from W/P1 down to W/PSR (arrow 1), making labor cheaper for firms. Firms responded by hiring more workers, increasing employment from N1 to NSR, moving the equilibrium from A to B. In the long run, workers renegotiate wages to restore their real purchasing power, pushing the real wage back up to W/P LR and employment returning to its natural level N1 = NLR at point C (arrow 2).
Following the expansionary monetary policy, China experienced a strong economic performance despite the financial conditions. Annual Real GDP Growth remained relatively high at approximately 9-10 percent, which indicates an increase in output that is consistent with the AD-AS and IS-LM models. Inflation remained relatively moderate immediately after, hovering around 6% in 2008 and sharply declining to -0.7% in 2009, and eventually stabilizing. Overall, the observed changes in output follow the model’s predictions closely.
While both models predicted a noticeable increase in the price level, the actual inflation rate was more modest than expected. A possible explanation is weak global demand during the financial crisis, which reduced pressure on prices even as domestic spending increased. Structural features of China’s economy, such as excess capacity, may also have dampened inflationary pressures by allowing businesses to meet demands through higher production rather than raising prices.


