Country Macroeconomic Overview
Spain is a high-income, advanced economy and a member of the European Union and the eurozone. Over the past 50 years, Spain’s macroeconomy has been characterized by a substantial increase in GDP, rising from $40.96B in 1970 to $2.04T in the present day (2026). The Spanish economy is very service-oriented, with tourism playing a large role in economic output. Despite overall long-term growth, Spain has experienced some macroeconomic volatility, notably a severe recession from 2008 to 2013, during which the unemployment rate soared to over 27%. Recently, even with the contractionary economic effects of COVID-19, the country’s unemployment rate has decreased to approximately 10%, while other measures, such as investment, consumption, and wages, have all followed an upward trend. (1)
Macroeconomic Indicators and Analysis
Investment and Consumption
This graph shows the relationship between consumption and investment. Notably, when consumption decreases around 2000, investment rises. Consumption has been relatively volatile. Investment was very low before 1995, but has shown more movement in recent years.
Data gathered from the International Monetary Fund datamapper.
GDP
This graph shows nominal and real GDP. Both nominal and real GDP follow the same upward trend over time. Real GDP is less volatile than nominal GDP because it removes the influence of inflation. From 2014 to 2024, Spain experienced an average growth rate of 2.4%. This is higher than the Euro Area average of 0.8% for the same time period. In 2024, the real GDP growth rate was 3.2% (2).
Data gathered from the World Bank.
Unemployment
This graph shows the total labor force unemployment and the youth unemployment rate. From 2014 to 2024, the Spanish unemployment rate averaged 16.3%, which is higher than the Eurozone average of 8.5%. When Spain entered a recession from 2008 to 2013, the unemployment rate rose. Youth unemployment closely matches total unemployment. Recently, Spain has had one of the highest youth unemployment rates in Europe. In 2024, the unemployment rate was 11.4% (3).
Data gathered from the World Bank.
Policy Analysis
2008 Financial Crisis
This policy was a large economic stimulus package called “Plan E” that included public works spending, tax cuts, financial support for firms, and measures to boost employment and access. It was implemented in 2008, with expansions in 2009 and 2010, as a response to the global financial crisis, which had affected Spain by triggering a large recession in which the housing market collapsed, and unemployment rose quickly. These policies affected aggregate demand through increased government spending, which increased consumption and investment.
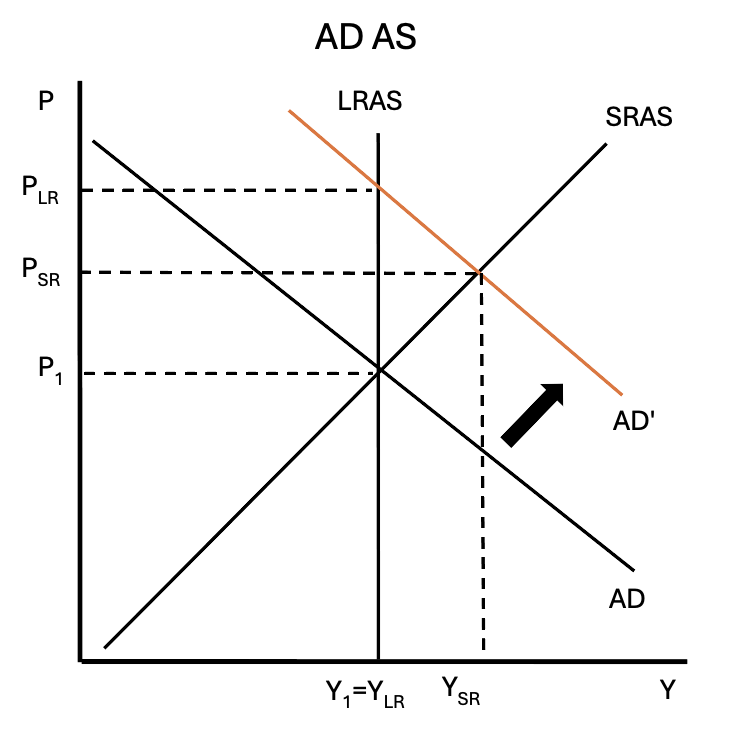
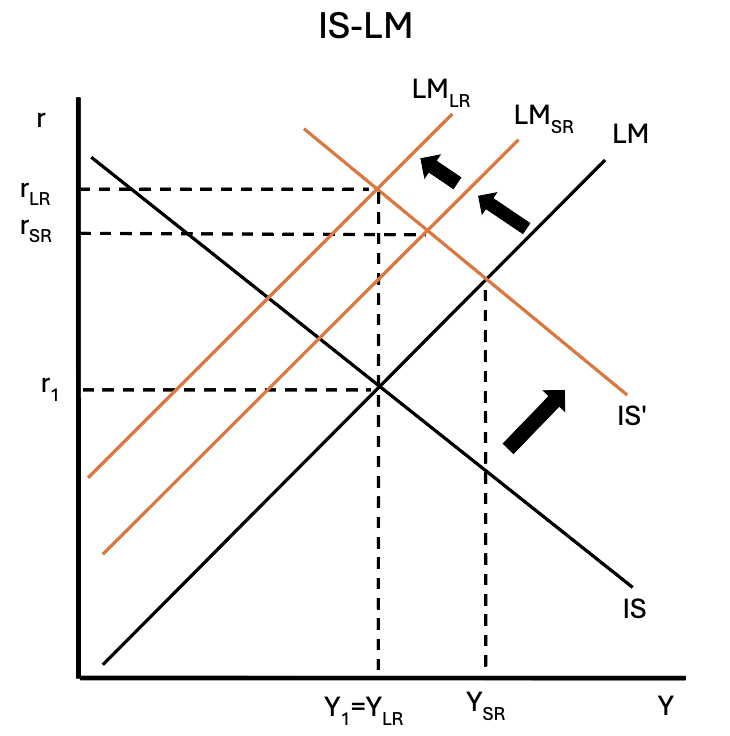
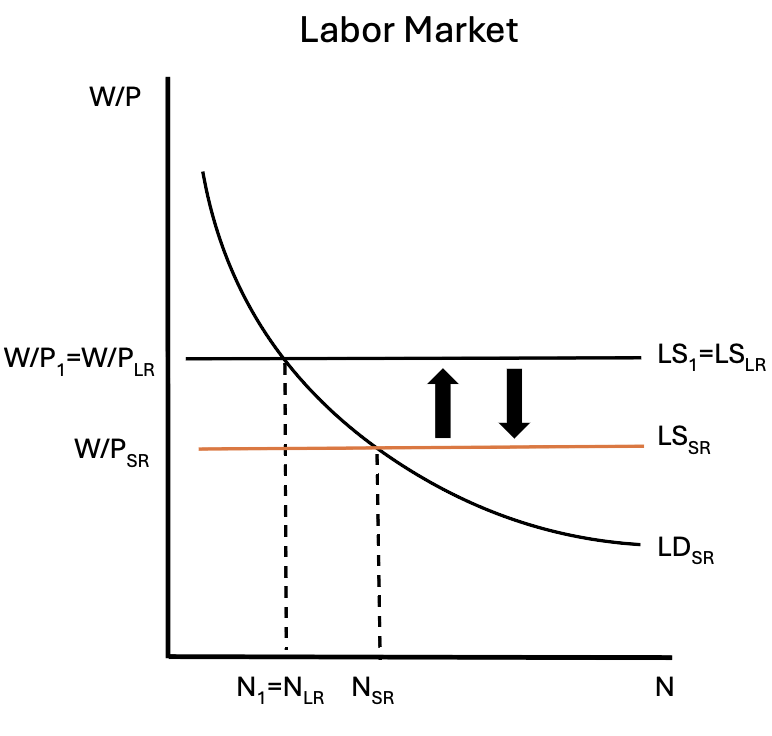
AD-AS, IS-LM, and labor market diagrams modeling their predictions when there is an increase in government spending.
When analyzing Spain’s fiscal stimulus against the predictions that we previously covered with the AD-AS model, the real-world outcomes are only partially consistent with real-world expectations. While the rightward AD shift from increased government spending occurred as we predicted, it was overwhelmed by the simultaneous collapse of private investment and consumption, which led to GDP falling to -3.8% in 2009 and inflation dropping from 1.4% to 0.9%, rather than rising. The labor market diverged most dramatically, with unemployment rising from 11.2% in 2008 to a peak of 26.1% in 2013, rather than recovering towards Nsr as our model predicts. A key discrepancy in the IS-LM model is that an outward shift should have raised interest rates, but as a eurozone member, Spain has no independent monetary policy, keeping the LM curve flat and mitigating the stimulus effect on output. Incorporating eurozone monetary constraints and the structural labor market would allow these models to better capture Spain’s prolonged recession (4, 5).
COVID-19 Policies
This policy, implemented in 2020 and 2021 as a response to COVID-19 after output decreased by 11%, used furlough programs to support workers, provided public credit lines to ~674,000 mostly small and medium-sized firms, implemented a labor market reform to decrease temporary contracts and increase permanent hiring, raised the minimum wage, introduced “minimum vital income,” and increased investment and reform in green energy and innovation using EU funds. These policies affected aggregate demand by maintaining household income and consumption through furloughs and minimum income benefits, and by supporting business spending and investment through credit lines. They also affected aggregate supply through labor reform, which increased labor supply and productivity by providing greater job stability and training, and through investments in innovation, which improved total output and capacity.
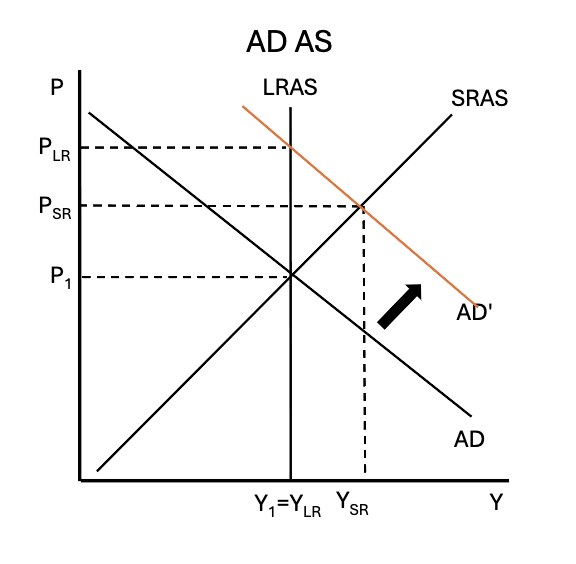
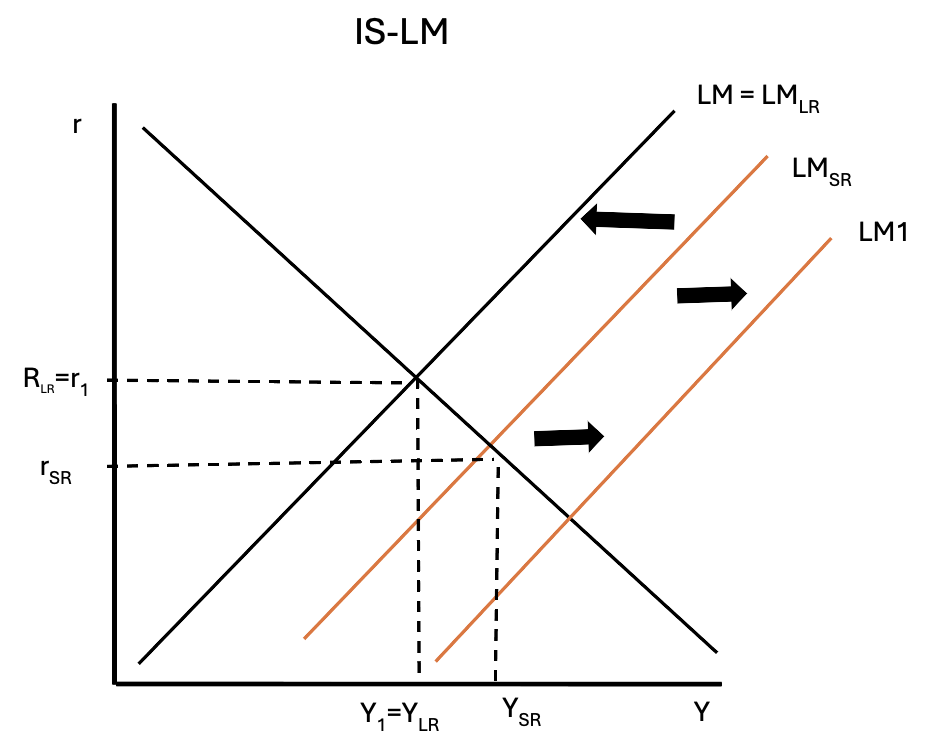
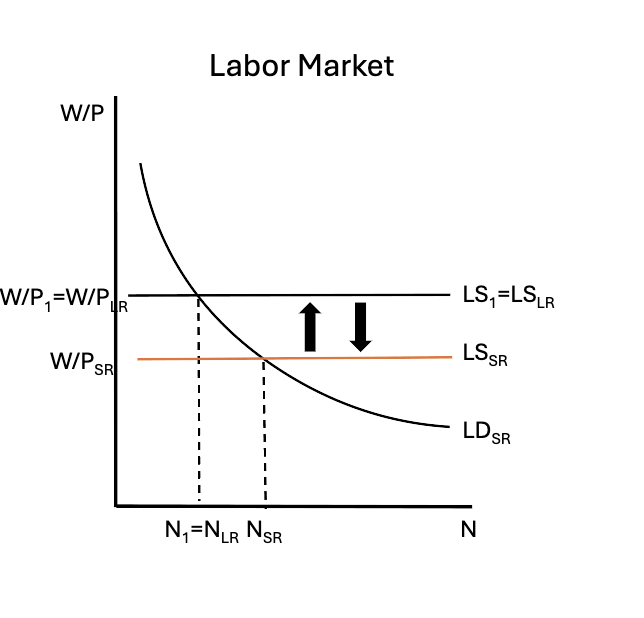
AD-AS, IS-LM, and labor market diagrams modeling their predictions when there is an increase in money supply (M).
When analyzing Spain’s COVID policy response against the AD-AS model predictions for an increase in money supply, the real-world outcomes mostly line up with what the model expects. The ECB’s Pandemic Emergency Purchase Programme expanded the eurozone money supply, which lowered interest rates and shifted AD to the right as investment and consumption picked up. In the short run, the model predicts Y, P, and N all rise while W/P falls, and the economy then moves back to YLR and NLR as P rises further to PLR. Spain’s data fits the short-run story pretty well: GDP bounced back from -10.9% in 2020 to 6.7% in 2021, unemployment dropped from 15.5% to 14.9%, and inflation jumped from -0.6% in 2020 to 6.6% in 2021, which makes sense given AD shifting right pushes prices up. The one thing the model doesn’t fully capture is how big the inflation jump was, which probably came from global supply chain disruptions pushing SRAS to the left at the same time. Adding that supply-side shock would help the model better explain Spain’s inflation surge (5, 6).
Notable Events and Economic Growth
The 1992-1993 Exchange Rate Crisis
In 1979, the European Monetary System was created, linking the currencies of several European states, including Spain, to stabilize exchange rates by converging economic performance. It was composed of 2 mechanisms: the European Currency Unit and the European Rate Mechanism. The Currency Unit is a basket of member state currencies that controls exchange rates by adjusting the basket’s composition according to relative GDP, giving outsized power to the German Mark. The European Rate Mechanism realigns European currencies when demand for one currency rises, such as when incomes rise. In 1989, Spain joined the European Rate Mechanism to increase discipline and credibility and maintain steady low inflation like well-performing member countries. In 1991-1992, the fiscal deficit widened to 5.0% of GDP. The European Rate Mechanism Crisis erupted in September 1992 when authorities resisted exchange rate market pressure by increasing short-term contest rate to 7-9%, pushing the economy into a recession. Beginning on Black Wednesday, the peseta depreciated by 5% and Spain faced massive capital outflows. Three further devaluations meant that by May 1993, the peseta had dropped by 20%. The weakening of the peseta eventually deepened the recession.
Despite weakening activity, real wages and consumer prices remained strong. There is a disconnect between modeling and real-world data, as during this time of disinflation, Spain’s wages and consumer prices increase above the European average. The adjustment process of the economy assumes that real appreciation of the exchange rate would have led to higher unemployment, slower wage growth, and lower inflation. Instead, employment remained low, wage increases were strong, and inflation was high. High financial costs and lack of wage flexibility squeezed profit margin, leading to bankruptcies and labor shedding. In 1993, employment fell by 4.3% due to a sharp rise in the unemployment rate, along with an increase in productivity and a moderation of the growth of unit labor costs. Inflation reacted slowly to growing gaps in the labor and product markets, remaining unchanged at 5.9% in 1992 and falling to 4.6% in 1993 due to labor market rigidities and the peseta depreciation (7,8).
Data sourced from the World Bank Development Indicators.
Data sourced from the World Bank Development Indicators.
Data sourced from the Banco de España historical exchange rate series.
In response to the crisis, Spain was compelled to devalue the peseta in an attempt to bring inflation under control. The devaluation had little impact on inflation as other factors were pushing up inflation levels. One important factor was granting independence to the central bank, which happened in 1994. Another was the central bank proving its credibility by attaining the inflation target. The biggest factor determining why devaluation did not decrease inflation was a Spanish commitment to meeting the convergence criteria before the Economic and Monetary Union came into effect in 1999 (7,8).
Economic Growth
Spain’s economic growth is characterized by long periods of delayed development followed by rapid modernization. Even though Spain was a major imperial power, it was slower to industrialize than other countries like Britain, France, and Germany in the nineteenth century. Because of this, Spain’s GDP per capita grew more slowly than that of the leading European economies, especially as most of the country relied on agriculture well into the early twentieth century, and political instability and weak infrastructure limited productivity growth. To further this, the Spanish Civil War from 1936 to 1939 resulted in even more economic destruction, and the Franco dictatorship increased stagnation through policies that restricted trade and foreign investment. This meant that by the 1950s, Spain was still significantly poorer than its European neighbors. The Maddison Project’s historical GDP estimates show that Spain’s income levels were lower than those of other European countries until the mid-1900s, reflecting delayed industrialization and relatively slow structural change.
Spain’s economic transformation occurred during the “Spanish Miracle” between 1959 and the mid-1970s. The 1959 Stabilization plan introduced a set of economic reforms that worked to stabilize the peso and opened Spain to trade and foreign investment. These policies led to Spain experiencing some of the fastest growth in Europe, with large increases in real wages and urbanization, along with a consistently improving quality of life. Growth continued after 1975, during the country’s democratic transition after Franco’s death, and accelerated with Spain’s entry into the European Economic Community in 1986. Spain’s EU membership expanded its access to trade, investment, and development funds, resulting in large-scale modernization and GDP growth. Overall, Spain’s GDP growth can be seen in its institutional reforms, integration into foreign trade markets, and capital accumulation and technological advancements (9, 10).
Data sourced from the Maddison Project Database via Our World in Data.
Recently, Spain’s economy has experienced the ups and downs of the business cycle, with the country hit especially hard by the 2008 global financial crisis due to its reliance on construction and a housing bubble. This led to a deep recession, with unemployment above 25 percent. Even with this, Spain recovered through growing exports, tourism, labor-market reforms, and increased investment. After COVID, Spain maintained a strong economy through an immigration-led increase in the labor force, strong service exports, and its links to European recovery funds. Despite these factors, there are still some long-term challenges of lower productivity growth, high youth unemployment, and reliance on tourism and temporary labor contracts. Overall, Spain’s history and trends suggest that a more open, politically stable, and connected economy has led to the strongest growth. In contrast, periods of isolation or financial imbalance have led to stagnation or crisis (9, 10).
Citations
Text Citations:
Assignment 2:
(1) International Monetary Fund. (n.d.). Spain: Country data. IMF DataMapper. https://www.imf.org/external/datamapper/profile/ESP
(2) Focus Economics. (n.d.). Spain GDP indicators. Focus Economics. https://www.focus-economics.com/country-indicator/Spain/gdp/
(3) Focus Economics. (n.d.). Spain unemployment indicators. Focus Economics. https://www.focus-economics.com/country-indicator/Spain/unemployment/
Assignment 3:
(4) Bureau of International Labor Affairs. (n.d.). Spain labor market brief. U.S. Department of Labor. https://www.dol.gov/sites/dolgov/files/ILAB/legacy/files/G20-spain-brief.pdf
(5) International Monetary Fund. (n.d.). Spain: Country data. IMF DataMapper. https://www.imf.org/external/datamapper/profile/ESP
(6) Cuerpo, C. (2025, June). Spain’s shift to success. Finance & Development, IMF. https://www.imf.org/en/publications/fandd/issues/2025/06/spains-shift-to-success-carlos-cuerpo
Assignment 4:
(7) Kowalewski, P. (2004, January). Lessons to be Learnt from the ERM and their Applicability to the Accession Economies seeking to join ERM2. wiiw.ac.at. https://wiiw.ac.at/lessons-to-be-learnt-from-the-erm-and-their-applicability-to-the-accession-economies-seeking-to-join-erm2-p-259.html
https://wiiw.ac.at/lessons-to-be-learnt-from-the-erm-and-their-applicability-to-the-accession-economies-seeking-to-join-erm2-dlp-259.pdf
(8) International Monetary Fund. (1995). Spain: Selected Background Issues. IMF Staff Country Reports, 1995(039), Article A003, A003. Retrieved Apr 30, 2026, from https://doi.org/10.5089/9781451811988.002.A003
https://www.elibrary.imf.org/view/journals/002/1995/039/article-A003-en.xml
(9) Our World in Data. (n.d.). GDP per capita, Maddison Project Database (Spain). Our World in Data.https://ourworldindata.org/grapher/gdp-per-capita-maddison-project-database?time=2020&country=~ESP&mapSelect=~ESP
(10) Organisation for Economic Co-operation and Development. (2025). OECD economic surveys: Spain 2025. OECD. https://www.oecd.org/en/publications/oecd-economic-surveys-spain-2025_abc5c435-en/full-report.html