
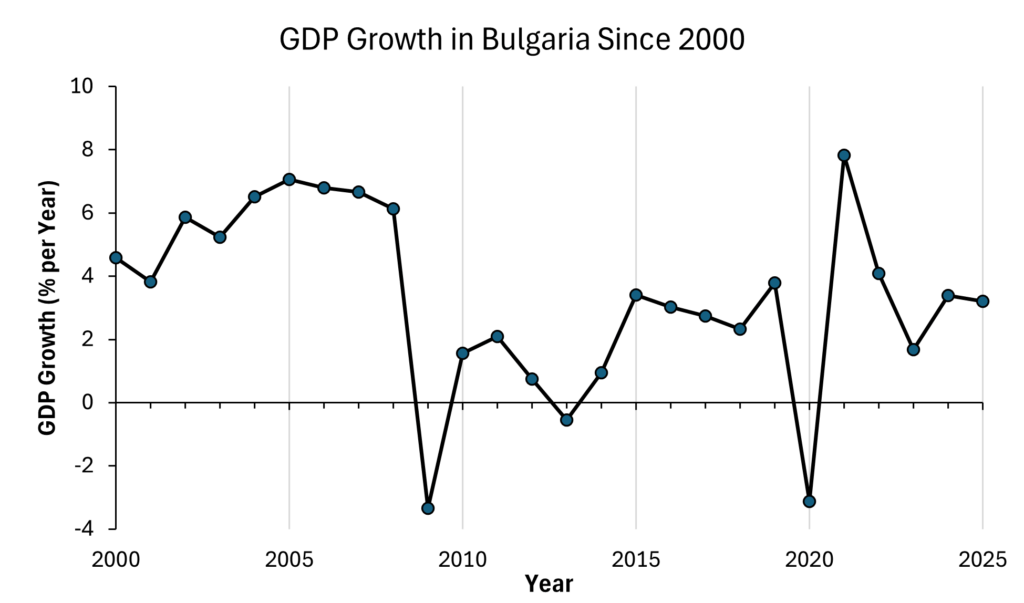
Bulgaria is exhibiting strong growth, though the pace has slowed from peak years following COVID. Growth is supported primarily by domestic consumption and investment, while external demand remains weaker due to slow growth in the Euro Area. This suggests that Bulgaria’s economy is stable but dependent on internal spending rather than strong export performance.
Over the medium term, growth is expected to remain moderate as inflation stabilizes and public investment continues. Output structure will play an important role in future growth. Services now account for roughly 60–65 percent of GDP, with industry around 20–25 percent and agriculture a small share, which is typical for an EU economy but implies that competitiveness in services and manufacturing is key for catching up. Newer growth drivers include IT, business process outsourcing, and shared service centers, which have expanded as foreign firms take advantage of Bulgaria’s relatively low costs and EU access. At the same time, productivity levels remain well below the EU average, and demographic decline is expected to slow potential growth unless reforms and investment raise productivity per worker.
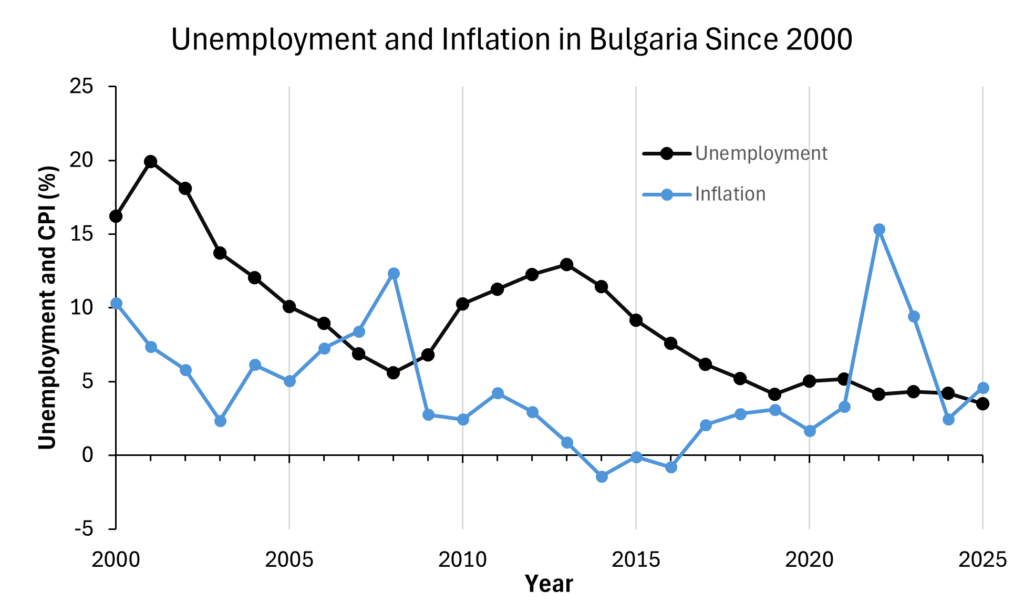
Bulgaria experienced a sharp rise in inflation following the global energy and supply shocks of 2021. Inflation peaked in 2022–2023 but has since begun to decline. Although price pressures are easing, inflation remains an important issue for households because it effects purchasing power and living standards. Stabilizing inflation is particularly important as Bulgaria prepares for eventual euro adoption and must meet convergence criteria.
Unemployment has remained stable around 5% for the last 10 years after a period of elevation following the 09′ crisis. The labor market did not experience pandemic shocks in the same way as inflation, and it seems to be maintaining a downward trend as the country continues to post strong growth.
Tab Content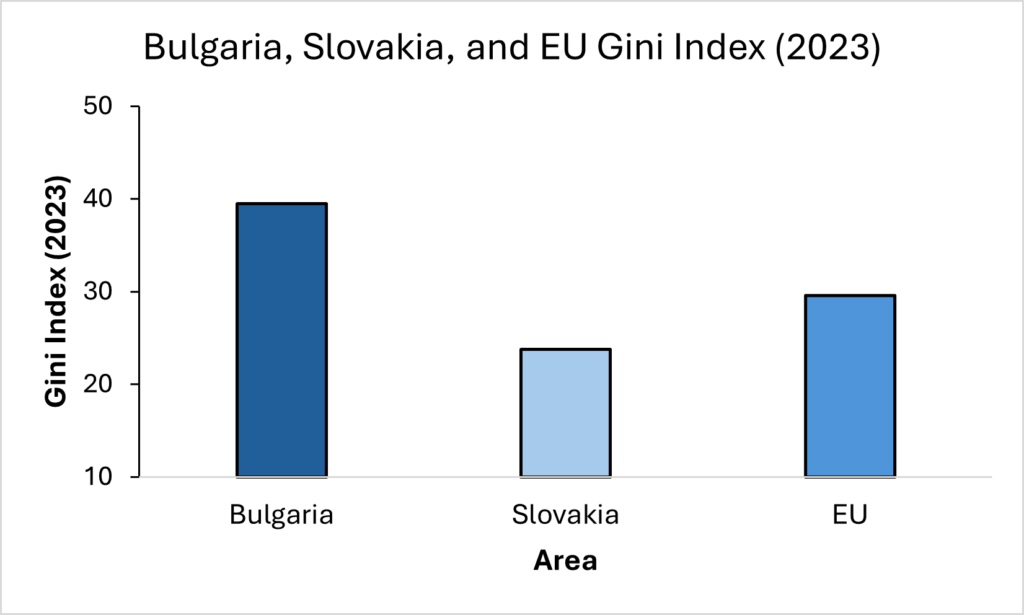
Bulgaria has the highest Gini index of any EU country (39.5). That is more than 10 points higher than the general EU and 16 points higher than the lowest value held by Slovakia. This indicates very high income inequality, especially within the European area.
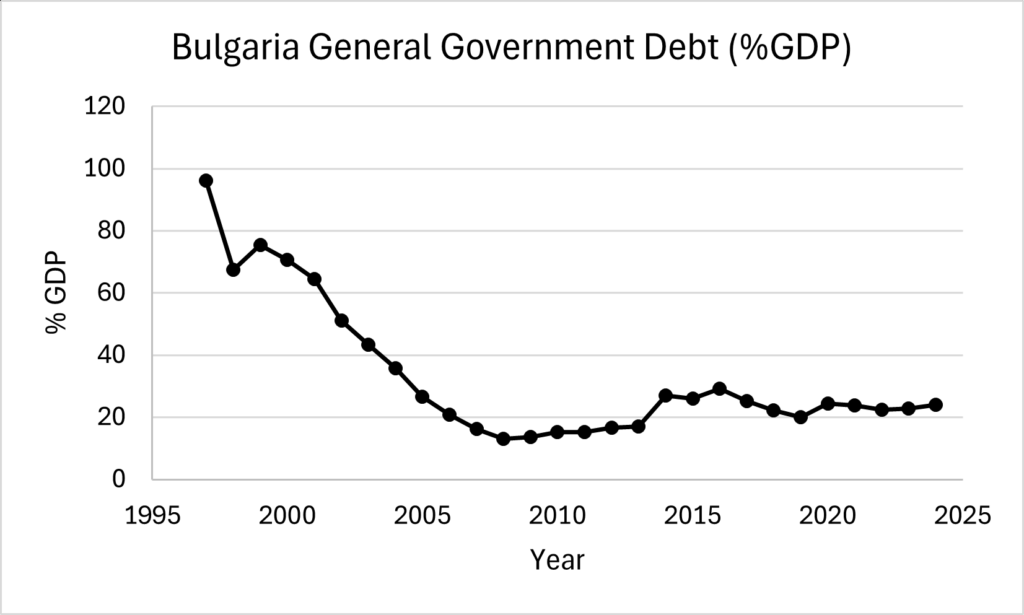
Bulgaria maintains relatively low public debt compared to most EU countries, which reflects historically cautious fiscal policy. However, recent years have seen rising fiscal deficits due to increased government spending and political instability. While debt remains manageable, persistent deficits could create fiscal pressures, particularly as Bulgaria seeks to meet the Maastricht criteria required for euro adoption.
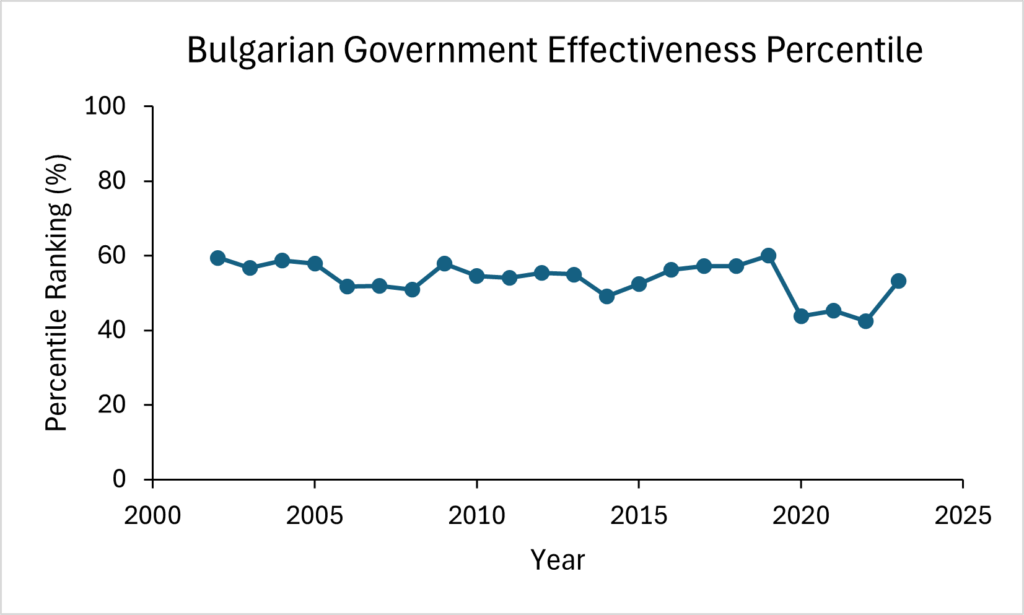
The World Bank measure of government effectiveness captures the quality of public services, competence of civil servants, quality of policy design, and numerous other metrics of government function. Bulgaria has maintained a middling global rank throughout the 2000s, but they remain underperforming amongst EU peers where they are one of only 4 EU countries below the 60th percentile. They also saw a noticeable drop in 2020 coinciding with a series of corruption scandals, administrative failures, and public protests, although they recovered in 2024.
Bulgaria introduced a proportional corporate income tax rate of 10 percent in 2007 and a flat personal income tax rate of 10 percent in 2008, replacing a system of higher, progressive rates with marginal PIT rates up to 24 percent and higher CIT prior to the reform.
The government’s stated objectives were to simplify the tax system, improve compliance, attract investment, and support growth after Bulgaria’s 2007 EU accession. The reform followed a decade of post‑transition recovery: GDP growth averaged between 5 and 7 percent in 2002–2006, but unemployment remained high (above 10 percent in 2003–2005). The macroeconomic environment just before the reform was a textbook boom under a currency board regime, with strong capital inflows, rapid credit growth, and falling unemployment but rising inflationary pressures.
The primary effects are outward shifts of both AD and AS as a result of increasing corporate profits, disposable income, and investment.
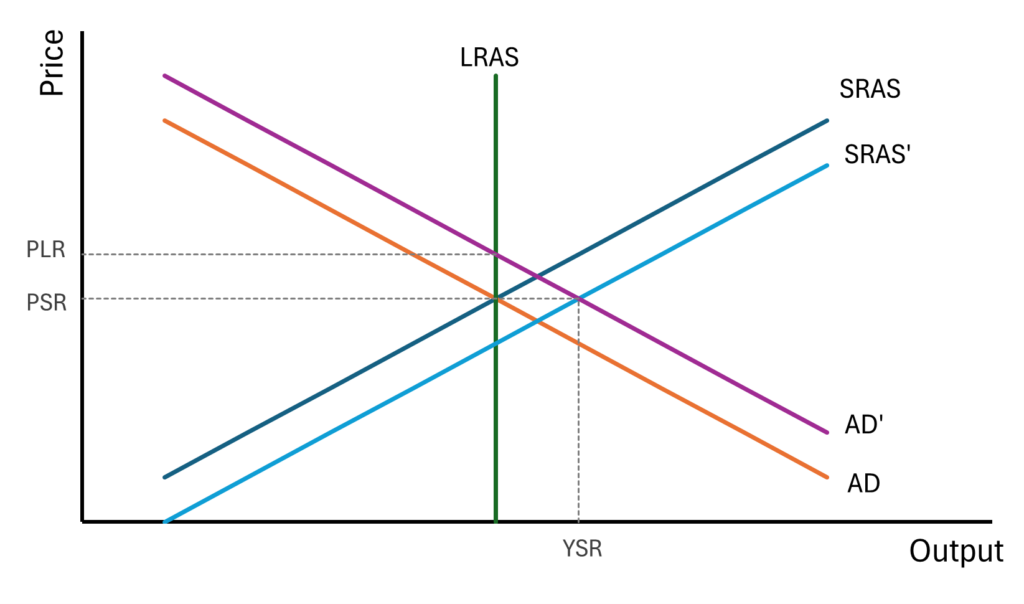
– In the short run AD shifts out due to higher disposable income fueling higher consumption, and higher returns on investment fueling animal spirits. SRAS shift outwards as corporate revenues and labor supply increases. Output increases and the effect on price is indeterminate but we assume AD and SRAS to balance out.
– In the long run output shifts back to LRAS but at a higher price due to the change in AD’.
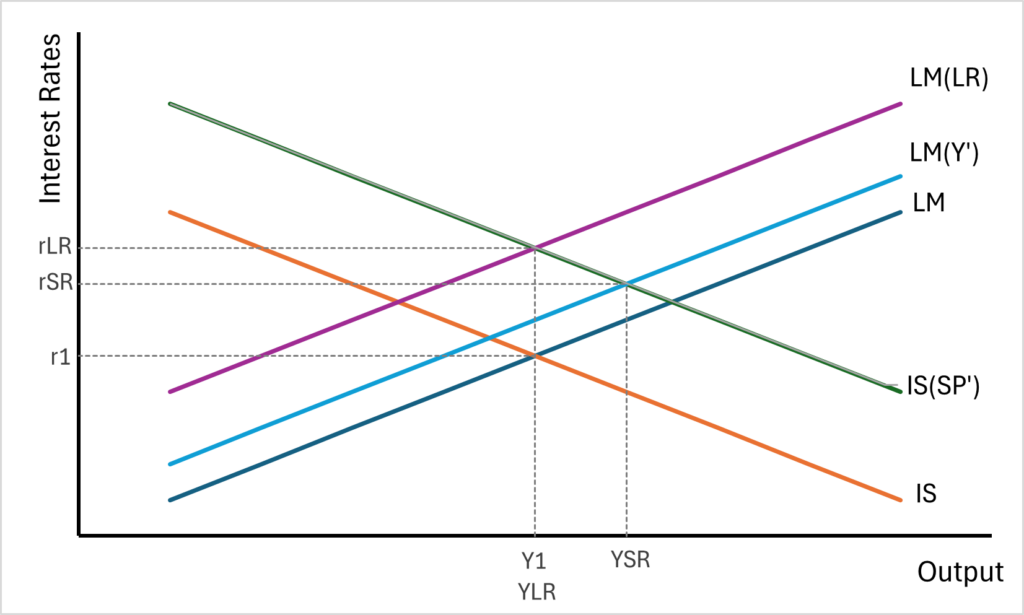
– In the short run LM shifts inwards modestly due to increasing money demand at higher incomes. Simultaneously IS shifts outwards aggressively due to increasing expectations for returns on investment and labor availability (SP). This results in the IS effect dominating the LM effect, leading to higher short run outputs consistent with the AD-AS graph. Both short run effects push interest rates upwards.
– In the long run LM shifts inwards once again due to the long run increase in price. This restores output to its long run level and pushes interest rates upwards once again.
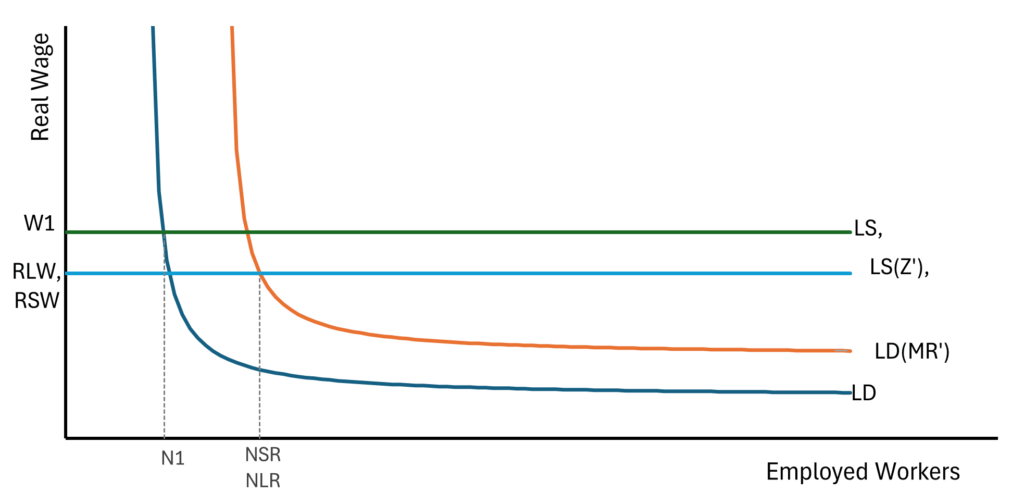
– In the short run the labor supply curve shifts down as tax cuts cause increasing flexibility of reservation wages downwards. Additionally, labor demand increases as marginal revenues for firms increases- shifting the optimal employment level out. This results in lower real wages in the short run and higher levels of employment.
– Nothing changes in the long run as neither the reservation wage or labor demand is time-sensitive. The price change is not a factor as in the long run price expectations and actual prices are equal.
| Year | GDP growth (annual %) | CPI Inflation (annual %) | Unemployment Rate (%) |
| 2004 | 6.5 | 6.2 | 12 |
| 2005 | 7.1 | 5 | 10.1 |
| 2006 | 6.8 | 7.3 | 9 |
| 2007 | 6.7 | 8.4 | 6.9 |
| 2008 | 6.1 | 12.4 | 5.6 |
From the table we can see that GDP growth fell through the change period, but CPI rose 5 percentage points while the unemployment rate fell 3.4 percentage points.
The fall in GDP is most shocking because in our model both short run shifts increased output. However, when we take into account the onset of the global financial crisis during the change period, we can see that the AD shift may have been opposes by falling foreign demand. Additionally, oil price shocks may have diminished the SRAS shift. Thus, in reality the economy may have experienced a mild net contraction of AD, leading to reduced GDP.
Although our model predicted long run increases in price, it predicted negligible short run changes. Empirically we see large inflation through the change period. This is best understood alongside the supply shocks to food and oil markets. This would have driven a cost-push inflation that is compatible with the simultaneous GDP contractions.
On 1 January 2000 Bulgaria implemented a comprehensive pension reform via the Mandatory
Social Insurance Code. This transformed the traditional pay‑as‑you‑go system into a three‑pillar structure:
– Mandatory state pay-as-you-go pillar
– Mandatory funded second pillar (initially for hazardous occupations and later for all workers born after 1959)
– Voluntary third pillar
The reform also separated the social insurance budget from the state budget, created specialized social insurance funds, and tightened the link between contributions and benefits. Further, female retirement ages were raised by 5 years and men by 3.
The immediate motivation was fiscal and demographic: the number of pensioners had been
rising while the number of contributors fell sharply due to transition‑related job losses and
early retirement policies. By 2002 the ratio of contributors to people receiving any type of
pension had deteriorated to about 0.92, meaning there were fewer contributors than
beneficiaries, and unemployment had climbed towards 18–20percent. Inflation had been tamed
from hyperinflation in 1997, but real output and employment were still recovering from a deep
crisis.
Overall, early retirement privileges were curtailed and minimum contribution periods were
increased, strengthening the link between lifetime contributions and benefits. This primarily effects LRAS by increasing the size of the full employment labor force and AD by reducing disposable income.
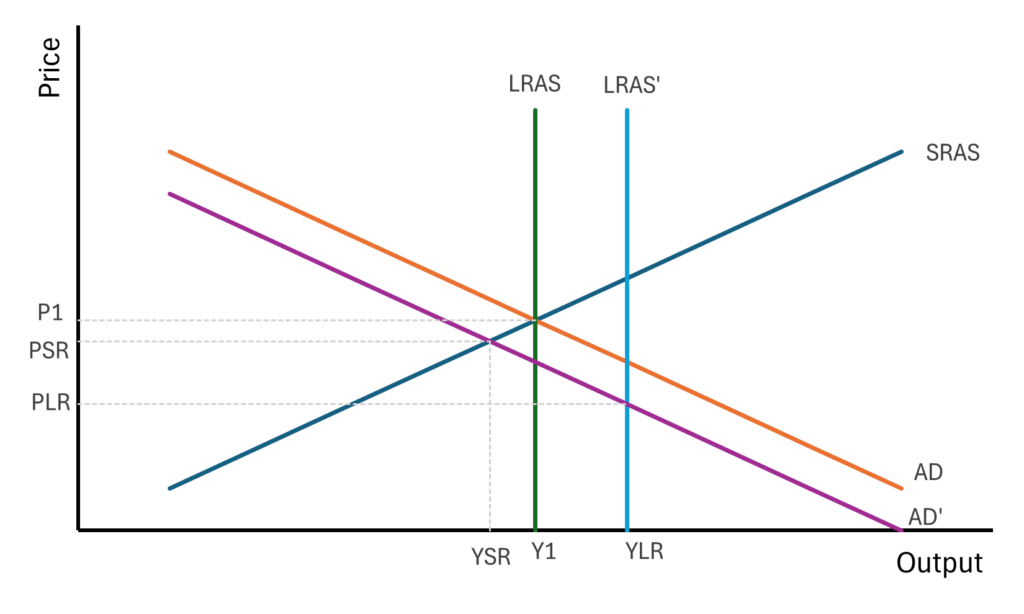
– In the short run aggregate demand shifts left due to decreasing consumption caused by higher SS contributions and reduced benefits. This shift causes lower output and prices in the short run.
– In the long run LRAS shifts right as the size of labor force and full employment increases. This pushes prices further downwards and increases output beyond its starting point.
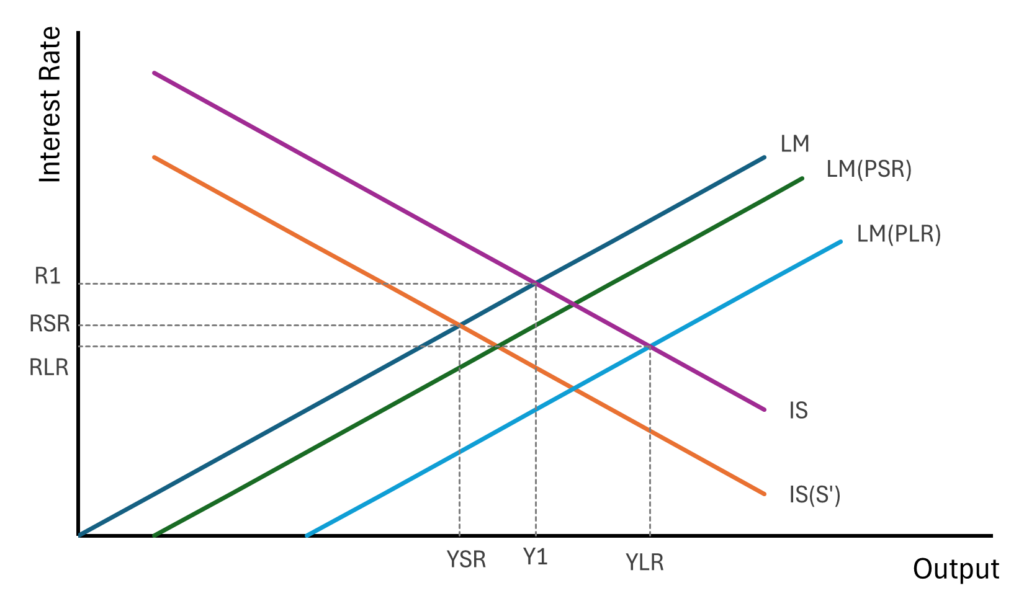
– In the short run LM shifts out due to the decrease in prices, IS shifts in due to the increase in private savings with lower pay-as-you-go requirements. Overall, the LM shift is small and the IS shift is expected to dominate, leading to reduced output and interest rates in the short run.
– In the long run LM shifts out once again due to the long run price change, this price change is much larger and thus the effect on LM is more exaggerated, pushing output to its increased long run value and further reducing interest rates.
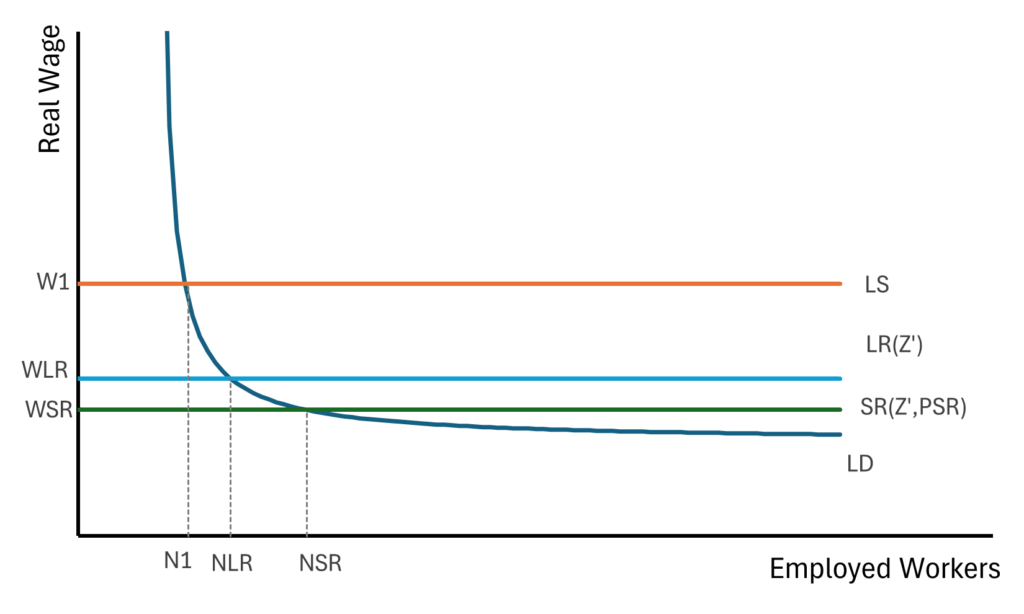
– In the short run the labor supply increases due to falling prices. Additionally, reservation wage falls as the labor market becomes tighter with the increased labor force and unemployment. This causes increases in total employment and decreases in real wages in the short run.
– In the long run the price effect disappears and labor supply shift up to the level established by Z’. This remains below LS1 but above LSSR. This causes a decrease in employment and increase in real wages acompared to the short run.
| Year | GDP growth (annual %) | CPI Inflation (annual %) | Unemployment Rate (%) |
| 1998 | 3.8 | 18.7 | 12.2 |
| 1999 | -8.4 | 2.6 | 14.1 |
| 2000 | 4.6 | 10.3 | 16.2 |
| 2001 | 3.8 | 7.4 | 19 |
| 2002 | 5.9 | 5.8 | 20.7 |
| 2003 | 5.2 | 2.3 | 13.7 |
| 2004 | 6.5 | 6.2 | 12 |
| 2005 | 7.1 | 5 | 10.1 |
From the table we see that GDP growth falls slightly the year of the reform but begins rising steadily afterwards. Inflation follows a clear downwards trend in the first 3 years post-reform. Unemployment continues an upwards trend that predates the reform, but begins declining two years after the reform.
Our model predicts a short run decline in inflation and a continuing decline as the economy moves to the long run. The short run trend is consistent with our model, although it breaks in 2004.
Our labor market model predicts significant increases in employment in the short run. While this is not observed immediately, unemployment does begin to fall 2 years post-reform. Our model explains the employment shift in terms of reservation wages and inflation expectations. Reservation wages are a more sticky variable due to human nature and may take several years to adjust to the reforms. Even though prices did fall, high inflation expectations likely slowed adjustment in labor supply.
Bulgaria’s central planning system collapsed in 1989. As Bulgaria transitioned to a market economy throughout the early 1990s, state owned banks engaged in poor lending habits. Many of their loans were risky and driven by political rather than economic factors- often subsidizing inefficient state-owned enterprise. This led to a buildup of faulty assets that the central bank implicitly guaranteed coverage over. As the central bank had to subsidize failed loans, and failed loans were continuously rolled over and extended, negative assets grew alongside the money supply. Sentiment regarding currency and credit were not yet at a breaking point, but it continued to ebb as the hole deepened.
In 1996 these issues accumulated beyond a tipping point:
– Multiple banks faced insolvency as depositors fled and non-performing loans grew to an unsustainable share of many bank portfolios.
– The central bank attempted to provide emergency liquidity but largely just assisted in paying off bad loans and accelerated money production.
– The lev depreciated massively and people fled to more stable currencies like the dollar.
– CPI skyrocketed over 1000% in 1997 in a period of hyperinflation.
Generally, we identify three primary pathways that these macroeconomic outcomes were produced.
- First, high default rates hurt banks directly via lost assets while causing massive public pessimism about their future solvency. This caused depositors to flee, forcing banks to aggressively pursue currently loaned funds to fill money demand. This created a credit crunch throughout the economy. Firms lost borrowing capacity and were facing increasingly aggressive demands on their held debts. This drastically reduced investment, output, and employment, shifting output inwards.
- As banks faced insolvency, the central bank rushed to bail them out and maintain the viability of credit markets. However, to do this they massively grew the money supply. Combined with general currency pessimism this led to a widespread abandonment of the lev and high rates of currency depreciation. As depreciation worsened input prices rose further and firms had to race to increase prices to maintain viability. These two channels of inflationary action worked as reinforcers, driving the hyperinflationary result.
- As the lev was undermined by dollarization and capital flight, external debts held by lev-dominated firms grew in real value. This put more pressure on firms to kill investment, default, or exit the market- further depressing output and employment.
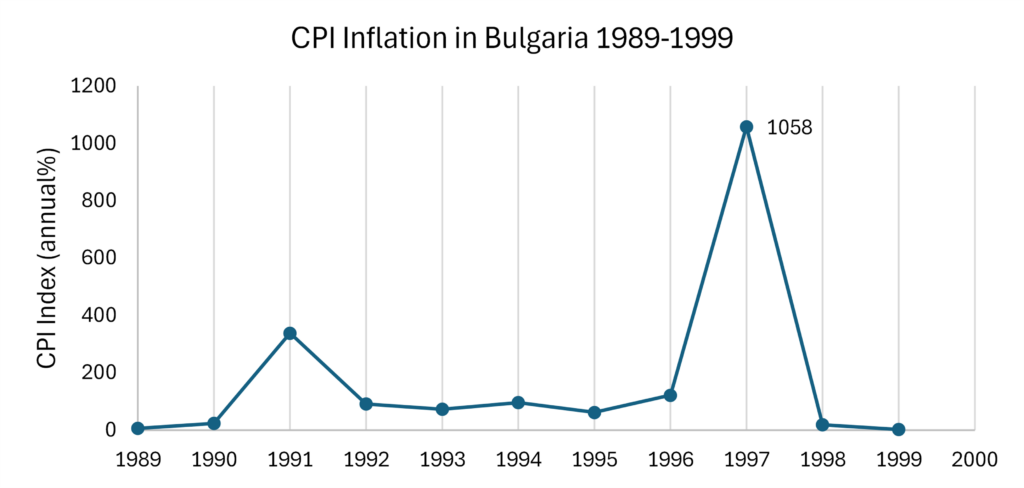
This graph shows the trajectory of CPI over the period in discussion. The index hovers around 100 throughout 1992-1996, which is already unsustainably high and shows the early effects of the faulty banking practices at play. In 1996-1997 the insolvency and sentiment crisis hits full force and CPI skyrockets to over 1000.
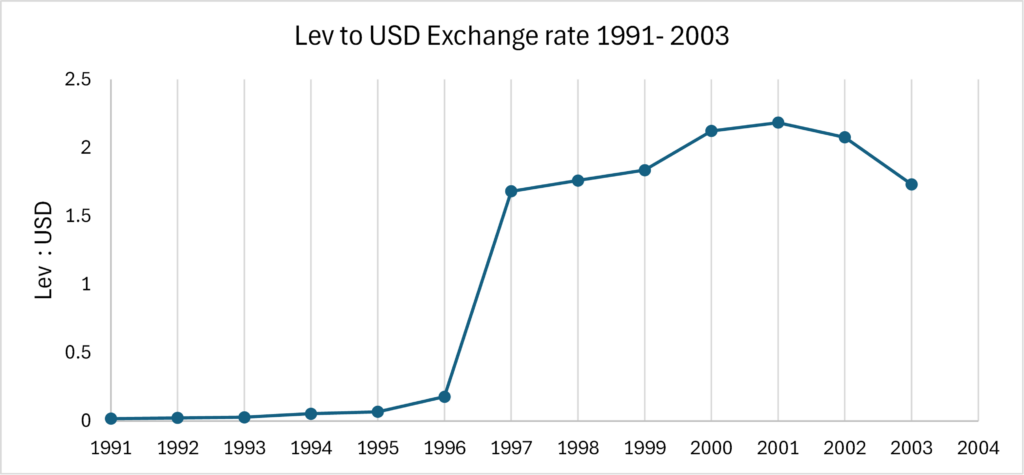
The exchange rate follows a similar pattern as inflation as the two are mutually reinforcing. The Lev is steadily depreciating through the period 1991-1996 as high inflation and pessimism cause capital flight. In 1997 depreciation increases drastically as inflation pushes people out of the currency and into foreign currency markets.
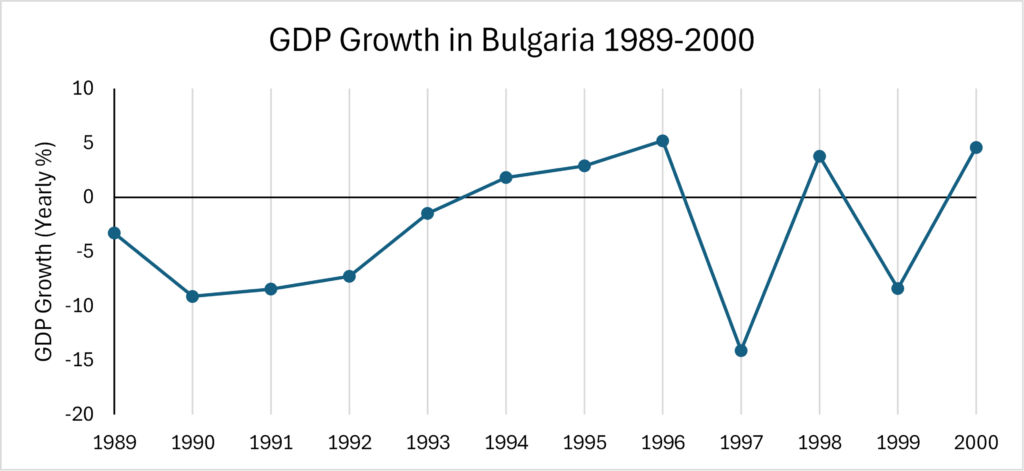
GDP is actually growing through the period 1990-1996, likely driven by unsustainable government deficit spending fueled by credit overextension. Additionally, some of this may have been recovery from the recession following socialist collapse and market benefits of the transition from a central planning economy. Nonetheless, when the hyperinflationary period hits in 1997 growth rates contract to nearly -15%, driven by radically reduced investment, consumer pessimism, and firms failing in the face of inflationary pressures on foreign inputs.
This episode of Bulgarian economic history fundamentally reshaped their entire economic constitution and political makeup. Several specific key things occurred.
- The introduction of the Currency Board Arrangement which pegged the Lev in a fixed ratio to the German Mark (and later the euro). This stabilized the real value of the lev and removed the capacity for autonomous monetary policy- disallowing the bank to continue to cover unsustainable deficits.
- Failing state-owned enterprises which had been a primary culprit of bad loans were replaced with private markets which acted more efficiently and did not require poor credit extension.
- The credit system was reworked as insolvent banks were allowed to close and state-directed loaning practices were culled.
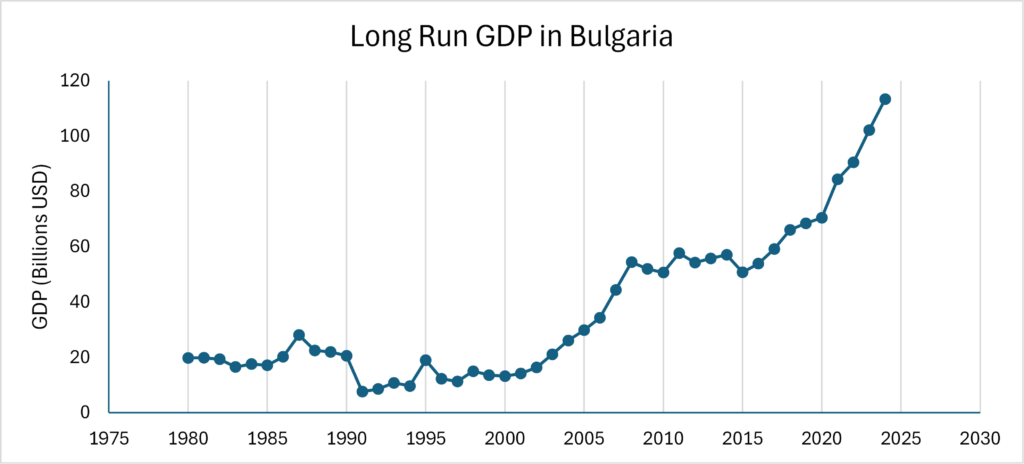
Bulgarian GDP data is available only for the period 1980 onwards. Through 1980- 2000 GDP actually trends downwards. This is largely explained by the institutional and political collapse of Bulgarian socialism and a difficult transition to market economy.
Moving forward, starting in the early 2000s, the graph shows a sustained upward trend, indicating a period of steady economic growth. This recovery is closely tied to market reforms, increased foreign investment, and greater integration into global markets. Growth continues through the 2000s, with a slight slowdown around the 2008 financial crisis, before resuming afterward. Overall, this graph shows Bulgaria’s transition from economic contraction to gradual, stable growth. It clearly demonstrates the main pattern, which is a steep initial decline followed by long-run recovery and moderate expansion.
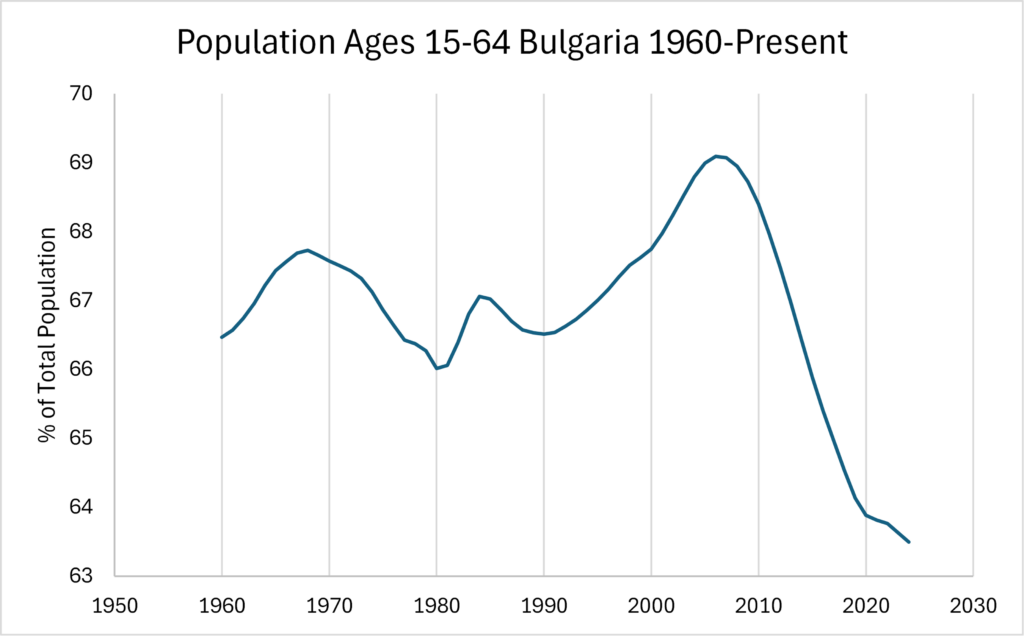
This graph shows the share of the population aged 15–64, which represents the working-age population of Bulgaria. Unlike the GDP graph, which trends upward, this graph shows a gradual decline over time, especially after the early 2000s. From a macroeconomic perspective, this is important because the size of the working-age population directly affects labor supply. This declining share indicates that fewer people are available to work, directly impacting the economy and the production of goods and services, and contributing to the progress of economic growth. It is important to note that even if productivity improves, a shrinking labor force can limit overall output.
The downward trend reflects broader demographic challenges, including low birth rates and population aging. As a result, while GDP per capita is rising, the economy faces constraints on growth due to a smaller labor base. This graph highlights the current problem of economic growth occurring while there exists a demographic decline.
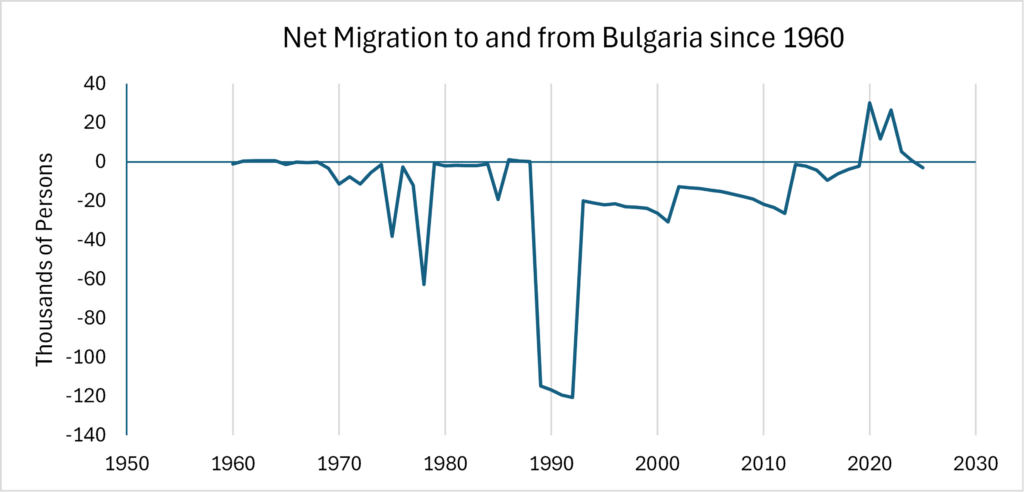
This graph tracks Bulgaria’s net migration, showing whether more people are entering or leaving Bulgaria each year. It is observable that the values are consistently negative, especially during the 1990s, indicating that emigration has exceeded immigration over time. This pattern helps explain the decline in the working-age population seen in Figure 2. Many of those leaving Bulgaria are younger and economically active individuals, which reduces the labor force and can lead to a “brain drain.” A brain flow is an economic term that refers to a period when a country loses its educated, skilled, or talented people because they move to other countries. This outflow of workers weakens long-term growth potential by reducing both the quantity and quality of labor.
From a growth perspective, persistent negative migration acts as a structural constraint limiting the potential growth, so even during periods of rising GDP per capita, the loss of population, particularly skilled workers, limits the country’s ability to sustain high levels of economic growth.
When considering what the three graphs display, we can see that Bulgaria’s economic growth is uneven and constrained by demographic factors. GDP data shows that the country has successfully transitioned to a growing market economy. However, demographic and immigration data demonstrate the challenges pushing back on the growth. One problem identified is the declining working-age population and persistent emigration. This combination suggests that while Bulgaria has achieved steady increases in GDP per capita, its long-term growth prospects depend on addressing labor shortages and demographic decline. In other words, while economic growth is occurring, this is not happening under ideal conditions, and future growth will likely depend more on productivity improvements that can range from systemic/institutional improvements, as well as technological improvements, rather than labor force expansion. What is important in this situation is to allocate the existing labor force more efficiently to raise overall productivity. Rather than relying on increases in the size of the workforce, Bulgaria’s growth strategy would likely need to focus on improving output per worker through investment in human capital, technology adoption, and institutional efficiency.
For example, strengthening education, encouraging skill development, and improving access to higher-productivity sectors would help ensure that the current population contributes more effectively to economic output. Some potential solutions to the brain drain would be to improve the economic conditions of the workforce and the ability for individuals to pursue long-term professional opportunities within the country. This could include policies aimed at increasing wages in high-skill sectors, improving job quality, and expanding career mobility.
Additional measures such as targeted benefits for young professionals, incentives for returning migrants, and support for entrepreneurship could help reduce emigration pressures. Ultimately, creating conditions where skilled workers see clear opportunities for advancement and stability within Bulgaria would help retain human capital and support more sustainable long-run economic growth.