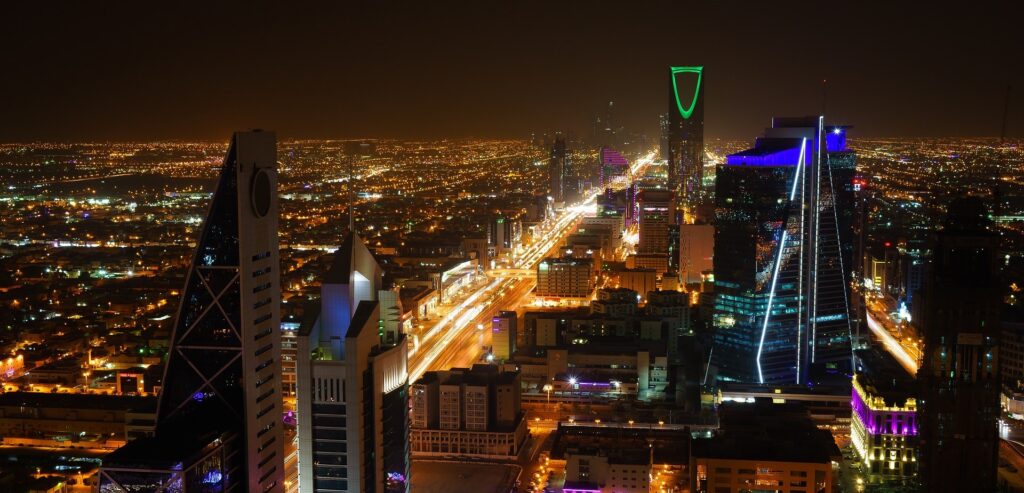
The population of Saudi Arabia is 35.17 million people as of 2026. Saudi Arabia is a high-income country with one of the largest economies in the Middle East. Its high level of economic development is due to its massive oil reserves and several decades of oil exports; the GDP is 1.27 trillion USD as of 2025. Revenue from oil has enabled the government to invest heavily in infrastructure, healthcare, public services, and education. As a result, Saudi Arabia has achieved a relatively high GDP per capita.
A key part of Saudi Arabia’s economy is its heavy reliance on oil revenue. Therefore, Saudi Arabia’s economic growth is tied to the global price of oil. When the oil prices are high, government revenue increases, leading to higher public spending. In recent years, Saudi Arabia has been attempting to diversify its economy through the Saudi Vision 2030 reforms. The government has been promoting non-oil sectors such as tourism, entertainment, logistics, and finance (Vision2030, 2026).
The Saudi Riyal is pegged to the U.S. Dollar; this means the Riyal’s value is fixed at a set exchange rate against the Dollar (1 USD = 3.75 SAR, since 1986). This limits Saudi Arabia’s independent monetary policy to respond to domestic economic conditions, such as raising or lowering interest rates to control inflation or stimulate growth. While the dollar peg provides exchange rate stability and helps control inflation, it reduces monetary policy flexibility, making fiscal policy and government spending more important tools for managing the economy.
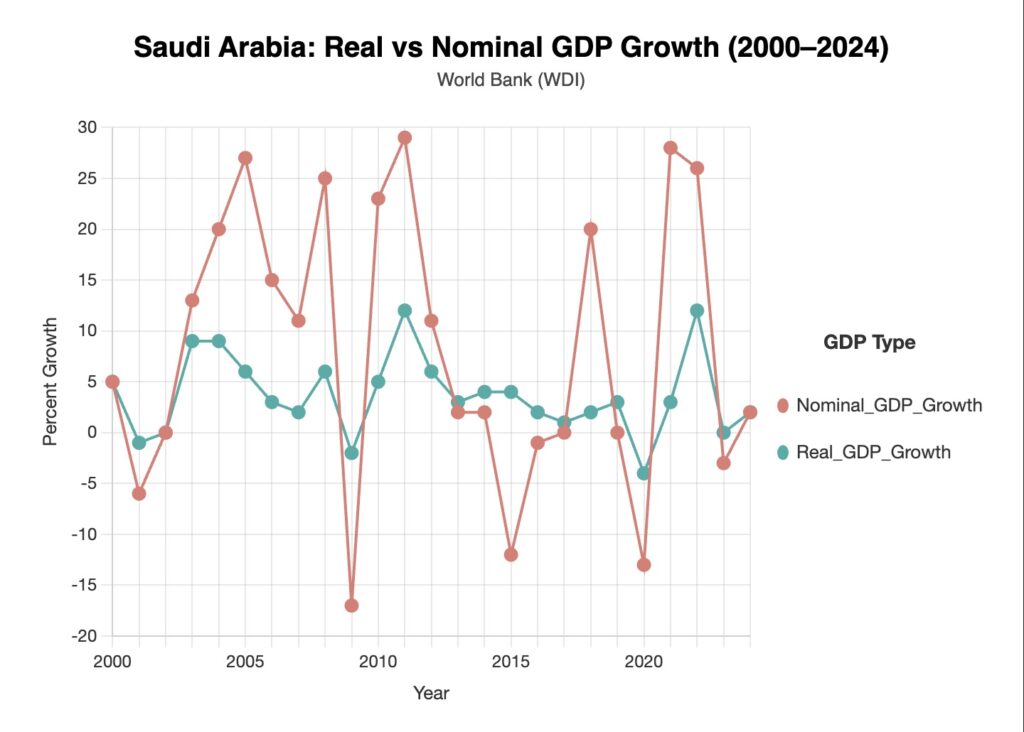
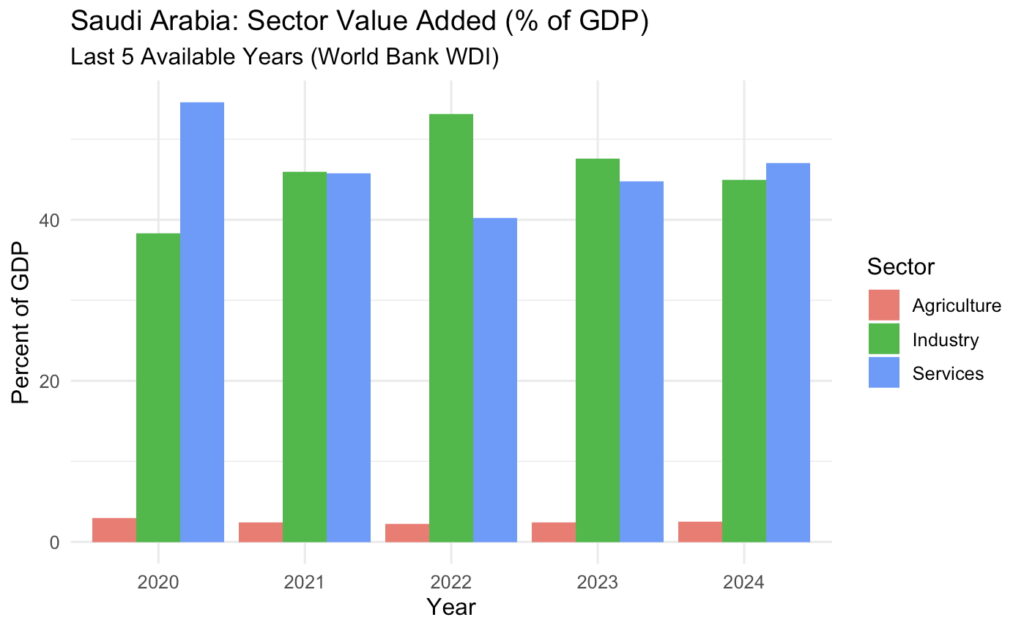
Saudi Arabia economics does face some structural challenges including inequality and cooperation. When it comes to inequality Saudi Arabia faces challenges with poverty and Gender. For a woman to work in Saudi Arabia they need written consent from a male guardian, creating an additional hurdle to participation in the economy (Von Stolzmann, 2025). The increased barrier is reflected in the female labor participation rate being way lower than the male one at 34.4% compared to 80.7% for the men labor participation rate (World Bank Group, 2024). The limited ability of females to participate in the economy increased their risk for poverty.
Saudi Arabia faces persistent challenges with corruption such as embezzlement, bribery, and abuse of power. These challenges are reflected in Saudi Arabia’s Corruption Perception Index of 57/100, according to Transparency International (2025). To address those challenges Saudi Arabia has turned to the Anti-Corruption Authority to increase enforcement of anti-corruption laws. From 2022 2025 investigation auctions have reached their peak, reflecting Saudi Arabia’s increased effort to reduce corruption (Bleik et al, 2025) . With less corruption Saudi Arabia hopes to over overcome the challenges associated with corruption for more stable economic growth.
Aggregate Demand and Supply Shocks
Policy: Vision 2030
Saudi Arabia’s Vision 2030, first introduced in April 2016, is a long-term government initiative that aims to transform the country’s economy through large-scale public investments and structural reforms. The program has the Saudi Arabian government increasing spending on infrastructure, technology, tourism, and major projects such as NEOM (“The Line” City). The government also intends to diversify the economy through moving away from oil dependence and developing a more knowledge-based society. The policy came to be in direct response to the falling oil price in 2015. This major dip in the global price of oil alerted the government to the risks associated with having an economy heavily reliant on only one good. By increasing government expenditure and investment, Vision 2030 stimulates economic activity and demand across multiple sectors. Therefore, this policy primarily acts as an aggregate demand shock, shifting the AD curve to the right through increased government spending and investment.
This is the AD-SR Model, there is an increase in AD. In the graph you can see the output increasing in the short and staying the same in the long run.
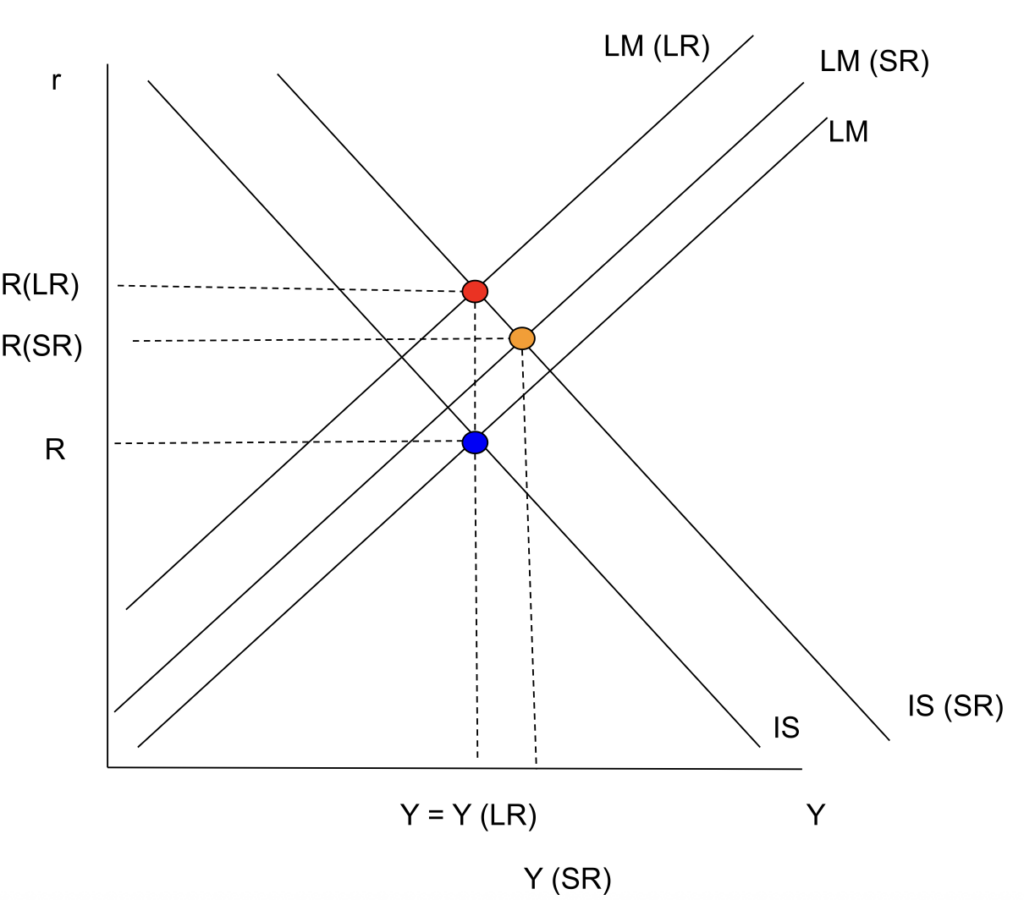
The blue dot indicators the original outcome.
The orange dot indicates the outcome in the short run.
The red dot indicates the outcome in the long run.
- Since Government spending increase the IS curve will move out
- Since P increased, the LM curve will decrease in the short run.
- Since P increased, the LM curve will decrease in the long run.
I = (SP, r)
Since r increase in the short run I will decrease in the short run
Since r increase in the long run I will decrease in the long run
C = (Y-T, CS, r)
Since Y and r both increase in the short run, Consumption is ambiguous in the short run
Since Y doesn’t change and r increase in the short run, Consumption increase in the long run
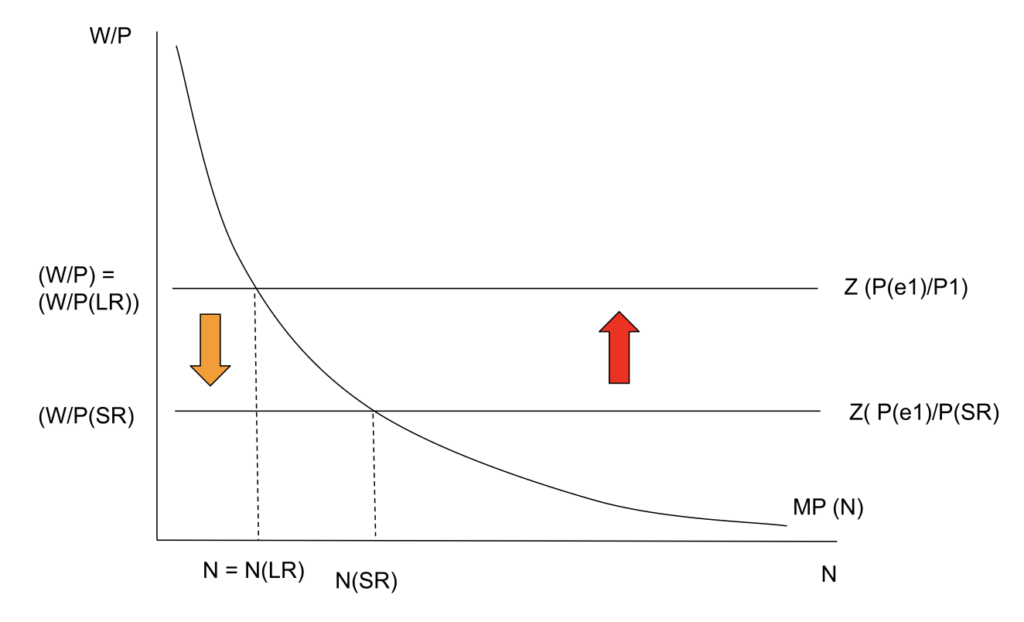

The real-world outcomes of the Saudi Vision 2030 policy are relatively consistent with what we found within the graphs. In the AD–AS model, an increase in government spending shifts aggregate demand to the right, leading to higher short-run output, which returns to its original level in the long run, accompanied by a higher price level. In reality, Saudi Arabia has experienced an increase in economic activity, especially in the non-oil sectors such as tourism, infrastructure, and technology. This supports what our graph shows: predicted higher short-run output. Additionally, the increase in demand has contributed to rising inflationary pressures. This is also consistent with the graph, which shows that the price level would rise. In the IS–LM graph, increased government spending shifts the IS curve to the right, leading to higher output and higher interest rates, which can partially crowd out private investment. This effect is consistent with the model’s prediction that investment may decrease even as overall economic activity rises. However, the long-run adjustments are more gradual than the graphs suggest. These large-scale projects (such as Vision 2030) are implemented over time, rather than immediately. As a result, changes are not instantaneous and take many years. While the long-term effects are present, they take significantly longer to occur. Overall, while the direction of changes in output and prices aligns with the model, the real-world effects occur more slowly and are less extreme than the theoretical predictions.
Policy: the Iran War
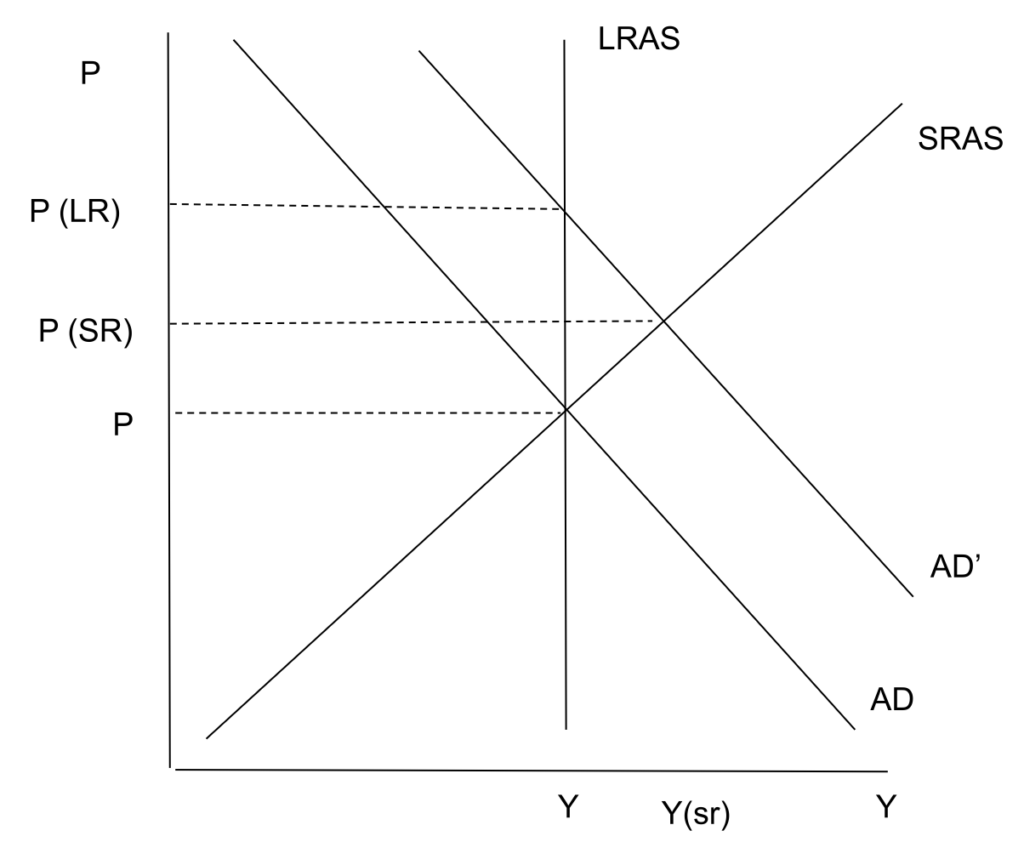
OPEC oil output declined significantly towards the end of March. Production fell by approximately 7.3 million barrels per day, the lowest level since COVID-19. The regional geopolitical conflict largely drove this sharp decrease, particularly the war in Iran involving both Israel and the United States. Due to the conflict, the Strait of Hormuz was shut down, disrupting shipping routes, forcing major oil-exporting countries such as Saudi Arabia, Iraq, and Kuwait to cut exports. This was an external shock that affected the global energy supply. The reduction in oil output limited the availability of a key input used in production across many industries, increasing costs for firms worldwide. As a result, aggregate supply is affected, leading to a leftward shift in the short-run aggregate supply (SRAS) curve. LRAS does not shift because the shcok mainly affects production costs in the short run, not the economy’s long-run productive capacity.
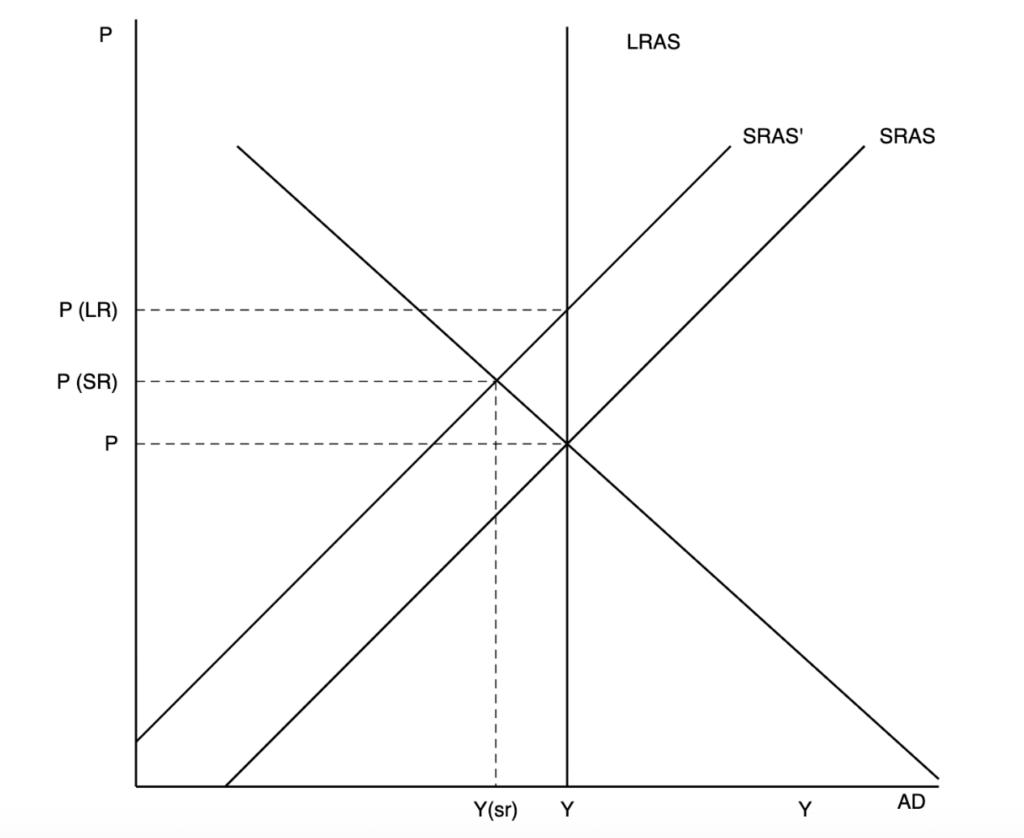
OPEC oil production cuts reduce the supply of a key input, raising production costs for firms. This shifts SRAS left to SRAS’, causing output to fall to Y(sr) in the short run while prices rise to P(SR). In the long run, nominal wages adjust downward, restoring the real wage, and SRAS’ shifts back toward LRAS, output returns to Y and the price level settles at P(LR), which is above the original P due to the higher cost environment.
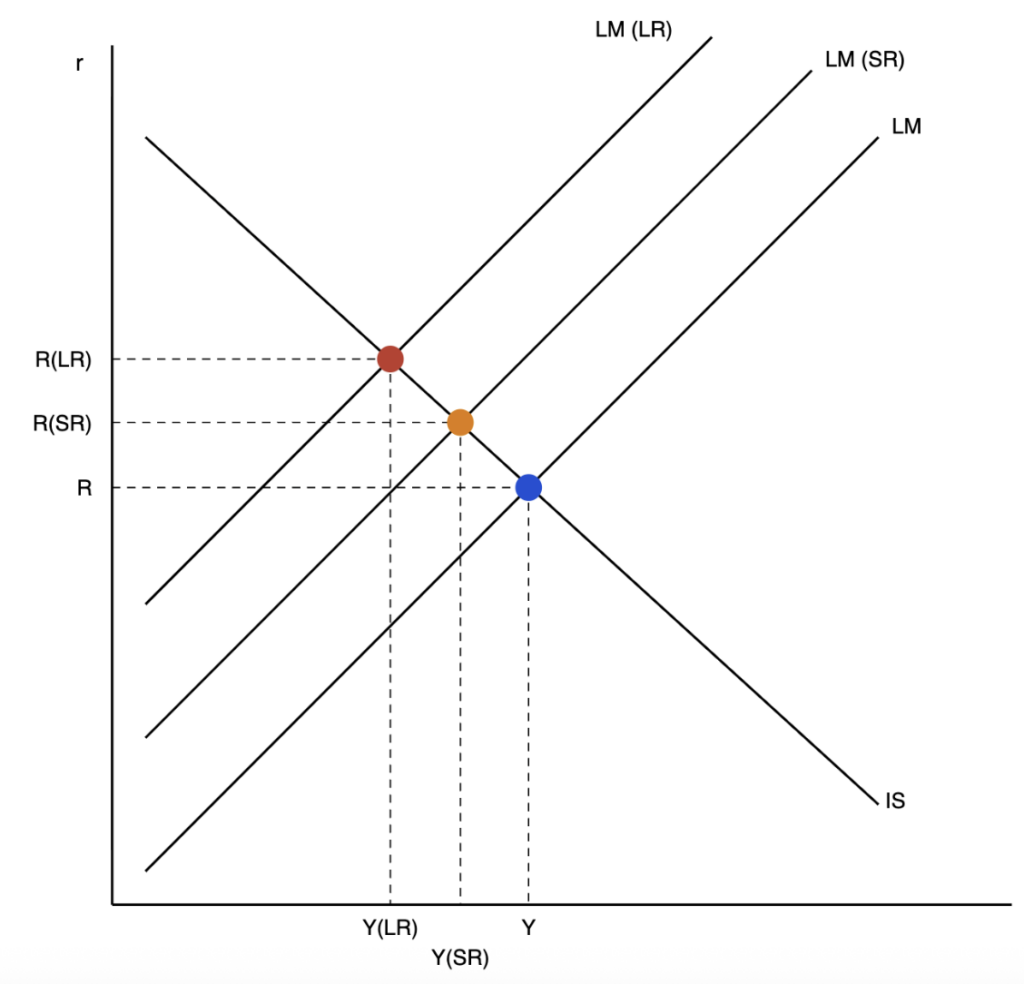
There is no shifter to IS. The price in the SR goes up so LM shifts left and the price in the LR goes up even more so there is another shift to LM.
IS is unchanged (no fiscal or monetary policy involved).
I = (SP, r) Since r increases in the short run, I will decrease in the short run. Since r increases in the long run, I will decrease in the long run.
C = (Y-T, CS, r) Since Y decreases and r increases in the short run, Consumption decreases in the short run. Since Y decreases further and r increases further in the long run, Consumption decreases in the long run.
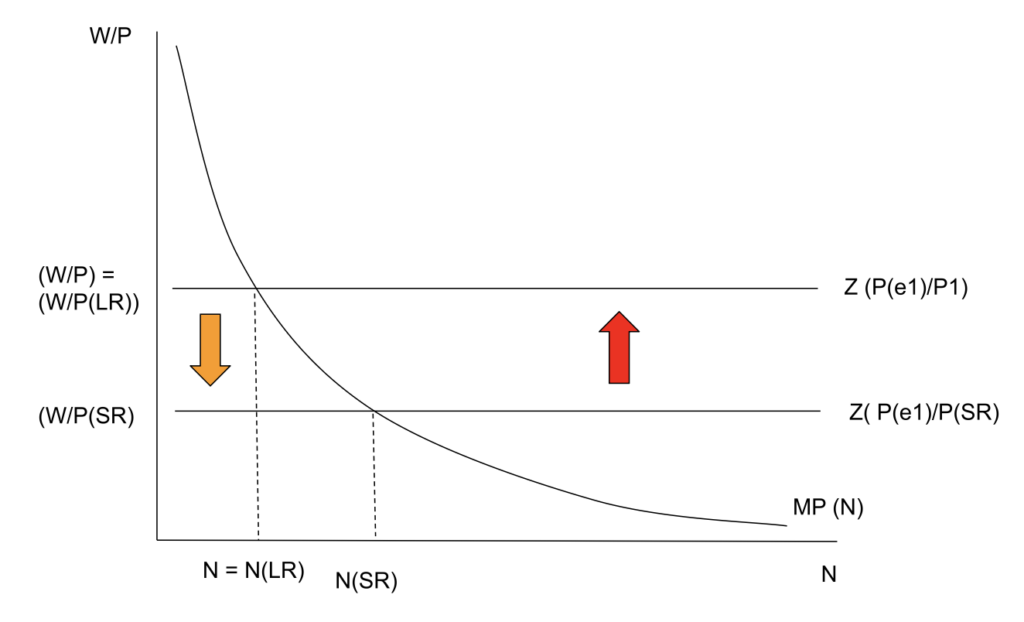

The real-world outcomes following the OPEC oil production cuts are pretty consistent with the predictions of the AD-AS and IS-LM graphs. In the AD-AS graph, a reduction in oil supply shifts the short-run aggregate supply (SRAS) curve to the left; as a result, output falls, and prices rise in the short run. In the long run, output eventually returns to its original level, with a higher price level. In reality, the significant decline in oil production led to higher global oil prices, increasing production costs across many different industries reliant on oil and gasoline (e.g., delivery services), contributing to inflationary pressures. This aligns with the graph’s prediction of higher prices. Also, higher energy costs usually slow economic activity, which supports the predicted short-run decrease in output. In the IS-LM graph, an increase in prices reduces the real money supply, shifting the LM curve to the left and raising interest rates, which in turn lowers investment and consumption, further reinforcing the slowdown in output. However, the real-world impact is usually less severe than the model predicts because Saudi Arabia, as a major oil producer, can adjust production or exports over time, which can partially offset the supply shock. Overall, the increase in prices and short-run decline are consistent with the graphs, although real-world adjustments tend to be slower and influenced by additional economic factors that the model does not show.
2014-2016 Oil Price Collapse
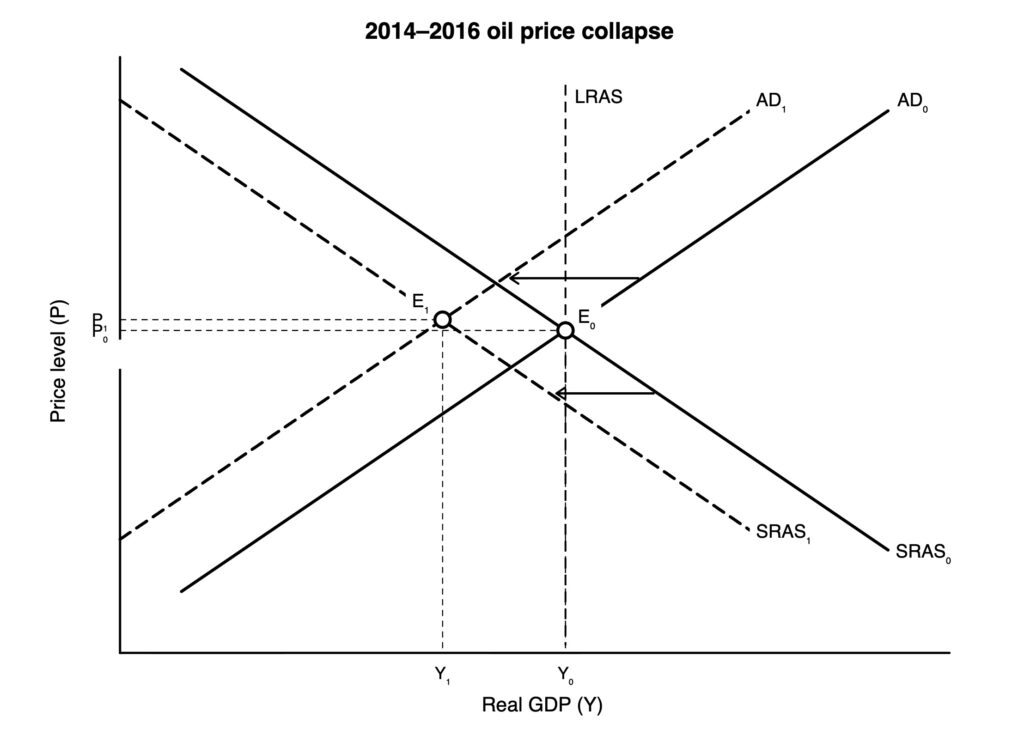
Saudi Arabia’s heavy dependence on oil meant the 2014-2016 oil price collapse had huge macroeconomic effects. The falling global oil prices, driven by increased supply, weak demand, and OPEC’s decision not to cut production, reduced export earnings and government revenue. The result was slower GDP growth, along with rising fiscal deficits, which led to reforms like Vision 2030 (talked about earlier). In AD-AS terms, lower oil revenue and government spending worked to shift aggregate demand left, while subsidy cuts increased production costs and shifted short run aggregate supply left, contributing to a higher inflation (around 4%) and lower output.
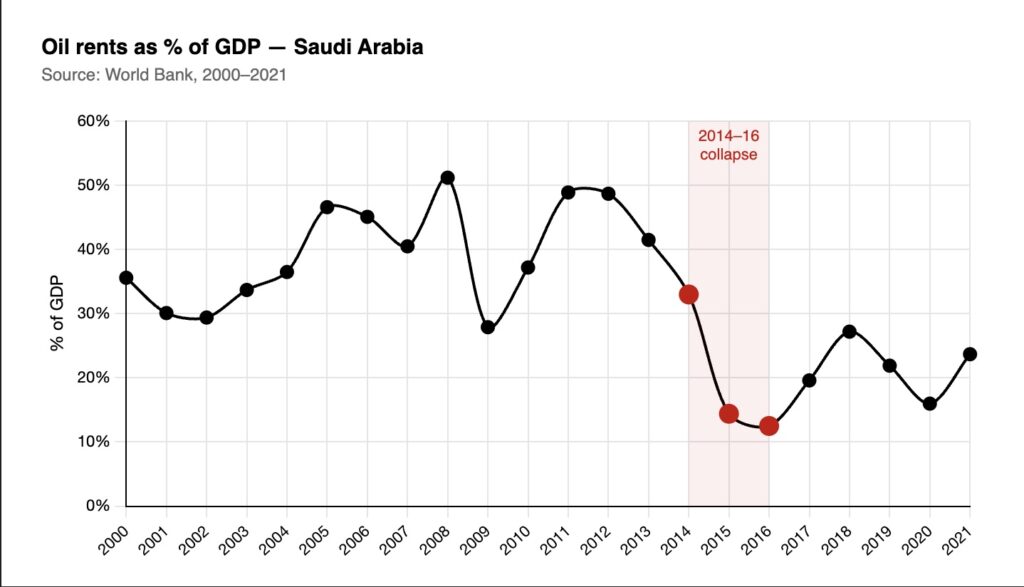
The graph shows that oil rents make up a significant portion of Saudi Arabia’s GDP, highlighting its dependence on oil. The sharp decline between 2014 and 2016 illustrates how vulnerable the economy is to oil price shocks, which helps explain the slowdown in growth and fiscal pressure during that period.
Economic Growth
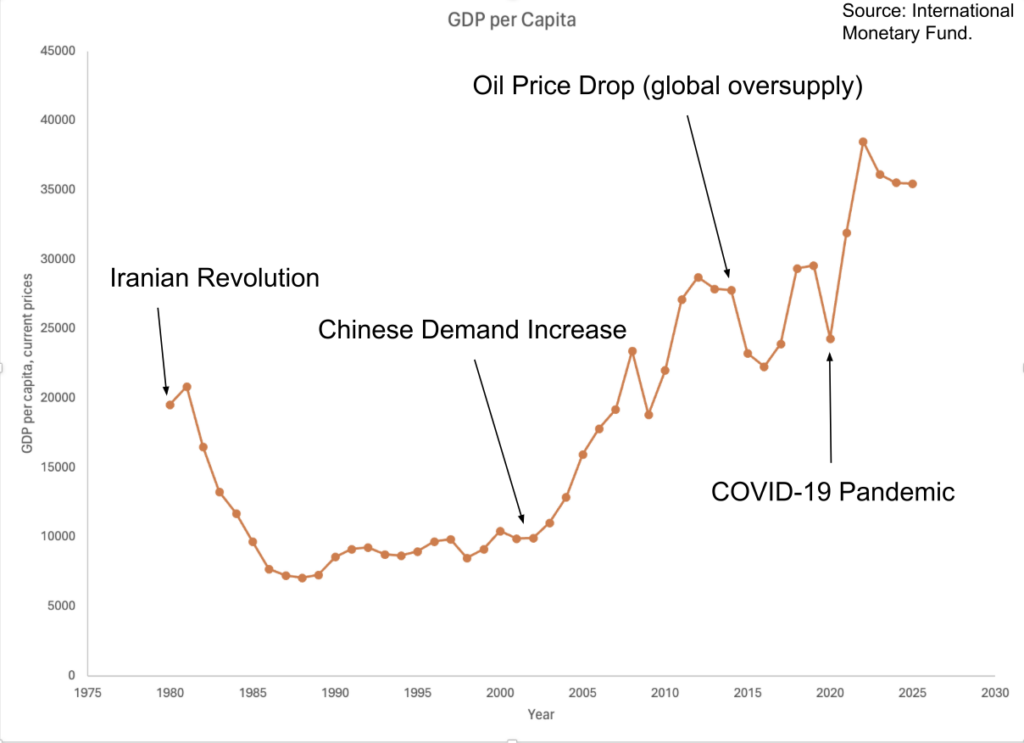
While oil was discovered in Saudi Arabia in 1938, GDP remained low before the 1970s because oil production was still developing, infrastructure and industrial capacity were limited, and the economy was largely based on low-productivity sectors, with no major oil price shocks yet to generate large revenues.
GDP spike in Saudi Arabia during the 1970s-1980s. This was not caused by a single event, but by a series of geopolitical shocks and supply constraints that sharply raised oil prices. During the early 70s, the Organization of the Petroleum Exporting Countries (OPEC) began coordinating production and pricing. This shifted power away from Western oil companies to oil-producing states.
In 1973, the first oil shock was due to the Yom Kippur War. Arab OPEC members imposed an oil embargo on the U.S. and its allies, and oil prices quadrupled from $3 per barrel to $12 per barrel.
The second oil shock was in 1979 due to the Iranian Revolution. The revolution disrupted oil production as Iran experienced political collapse. Oil output dropped significantly, causing prices to double again from $15 per barrel to a staggering $35 per barrel.
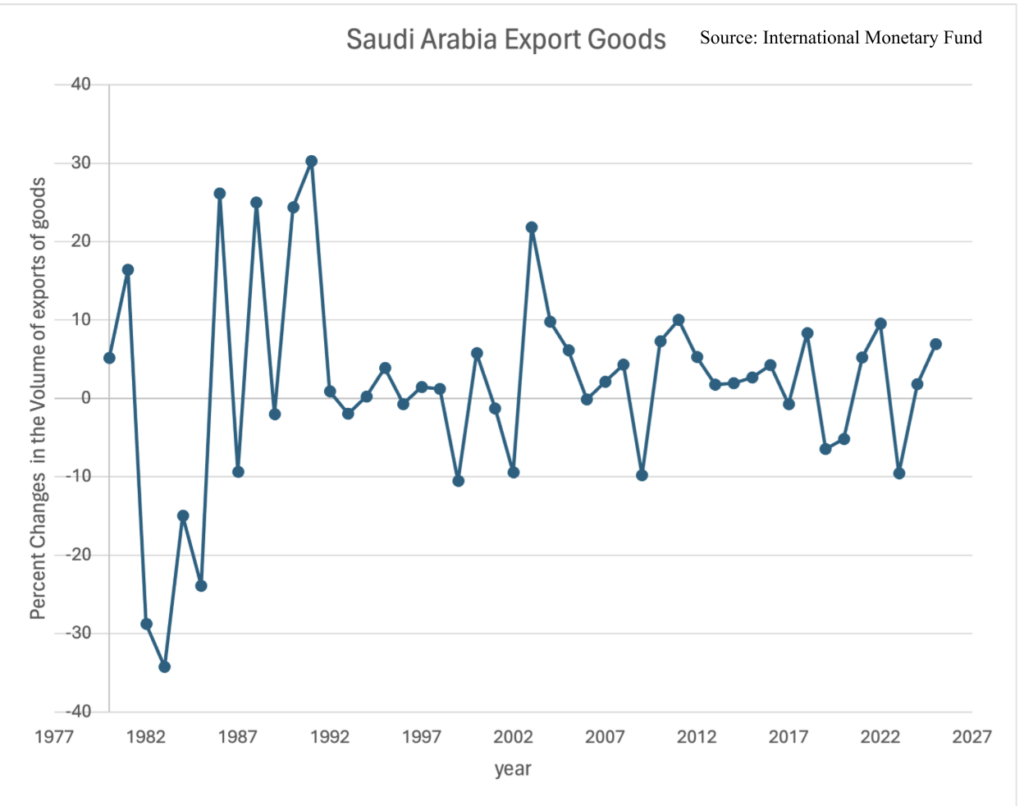
There was a prolonged period of relatively flat growth in Saudi Arabia from the mid-1980s to the early 2000s, largely due to lower and more volatile oil prices following the collapse of the early 1980s oil boom. This stagnation was followed by a renewed expansion beginning around 2003. A key driver of this recovery was rapid economic growth in China, which significantly boosted global oil demand.
Another slowdown occurred between 2014 and 2016, driven by a sharp decline in global oil prices. This was largely due to increased oil production, particularly from U.S. shale, combined with sustained output from OPEC countries. The resulting global oversupply caused oil prices to fall significantly, reducing Saudi Arabia’s export revenues. As a result, GDP growth slowed, and the government faced rising fiscal deficits, highlighting the continued dependence of the economy on oil.
In 2020, Saudi Arabia experienced a contraction in economic activity due to the global impact of the COVID-19 pandemic. Lockdowns and reduced travel led to a sharp decline in global oil demand, driving oil prices lower. This reduction in demand significantly lowered Saudi oil revenues, leading to a decline in GDP during this period.
Following the pandemic, Saudi Arabia entered a period of strong recovery from 2021 to 2023. As the global economy rebounded, demand for oil rose, driving up prices. This resulted in a surge in export revenues and accelerated GDP growth, with Saudi Arabia recording one of the fastest global growth rates in 2022. This period reflects the continued cyclical nature of the Saudi economy, driven largely by fluctuations in global oil demand and prices.
Work Cited:
Alatawi, O. D. “Combating Corruption and Promoting Economic Resilience: Legal and Institutional Reform in Saudi Arabia.” Humanities and Social Sciences Communications, vol. 12, no. 1, 2025, https://doi.org/10.1057/s41599-025-05873-x.
Bleik, T., D. Dondelinger, and R. Stobwasser. “Mid-Year 2025 Update: Nazaha’s Progress in the Fight Against Corruption.” JD Supra, 2025, https://www.jdsupra.com/legalnews/mid-year-2025-update-nazaha-s-progress-9700242/.
International Monetary Fund. “GDP per Capita, Current Prices: Saudi Arabia.” World Economic Outlook DataMapper, International Monetary Fund, Apr. 2025, https://www.imf.org/external/datamapper/NGDPDPC@WEO/SAU?year=2026.
International Monetary Fund. “Saudi Arabia: Volume of Exports of Goods.” World Economic Outlook Database, International Monetary Fund, Apr. 2025, https://www.imf.org/en/publications/weo/weo-database/2025/april/weo-report?c=456&s=TXG_RPCH&sy=1980&ey=2026&ssm=0&scsmx=1&ssd=1&scc=1&ssc=1&sic=0&sort=country&ds=.&br=0.
“Saudi Arabia.” Transparency International, 2025, https://www.transparency.org/en/countries/saudi-arabia.
Saudi Vision 2030. Kingdom of Saudi Arabia, 23 Feb. 2026, https://www.vision2030.gov.sa/en.
“Saudi Arabia.” World Bank Gender Data Portal, World Bank Group, 2024, https://genderdata.worldbank.org/en/economies/saudi-arabia.
“Saudi Arabia Tourist Visas.” Live and Let’s Fly, https://liveandletsfly.com/saudi-arabia-tourist-visas/.
Von Stolzmann, Stephanie. “Poverty in Saudi Arabia.” The Borgen Project, 11 Jan. 2025, https://borgenproject.org/poverty-in-saudi-arabia-2/.