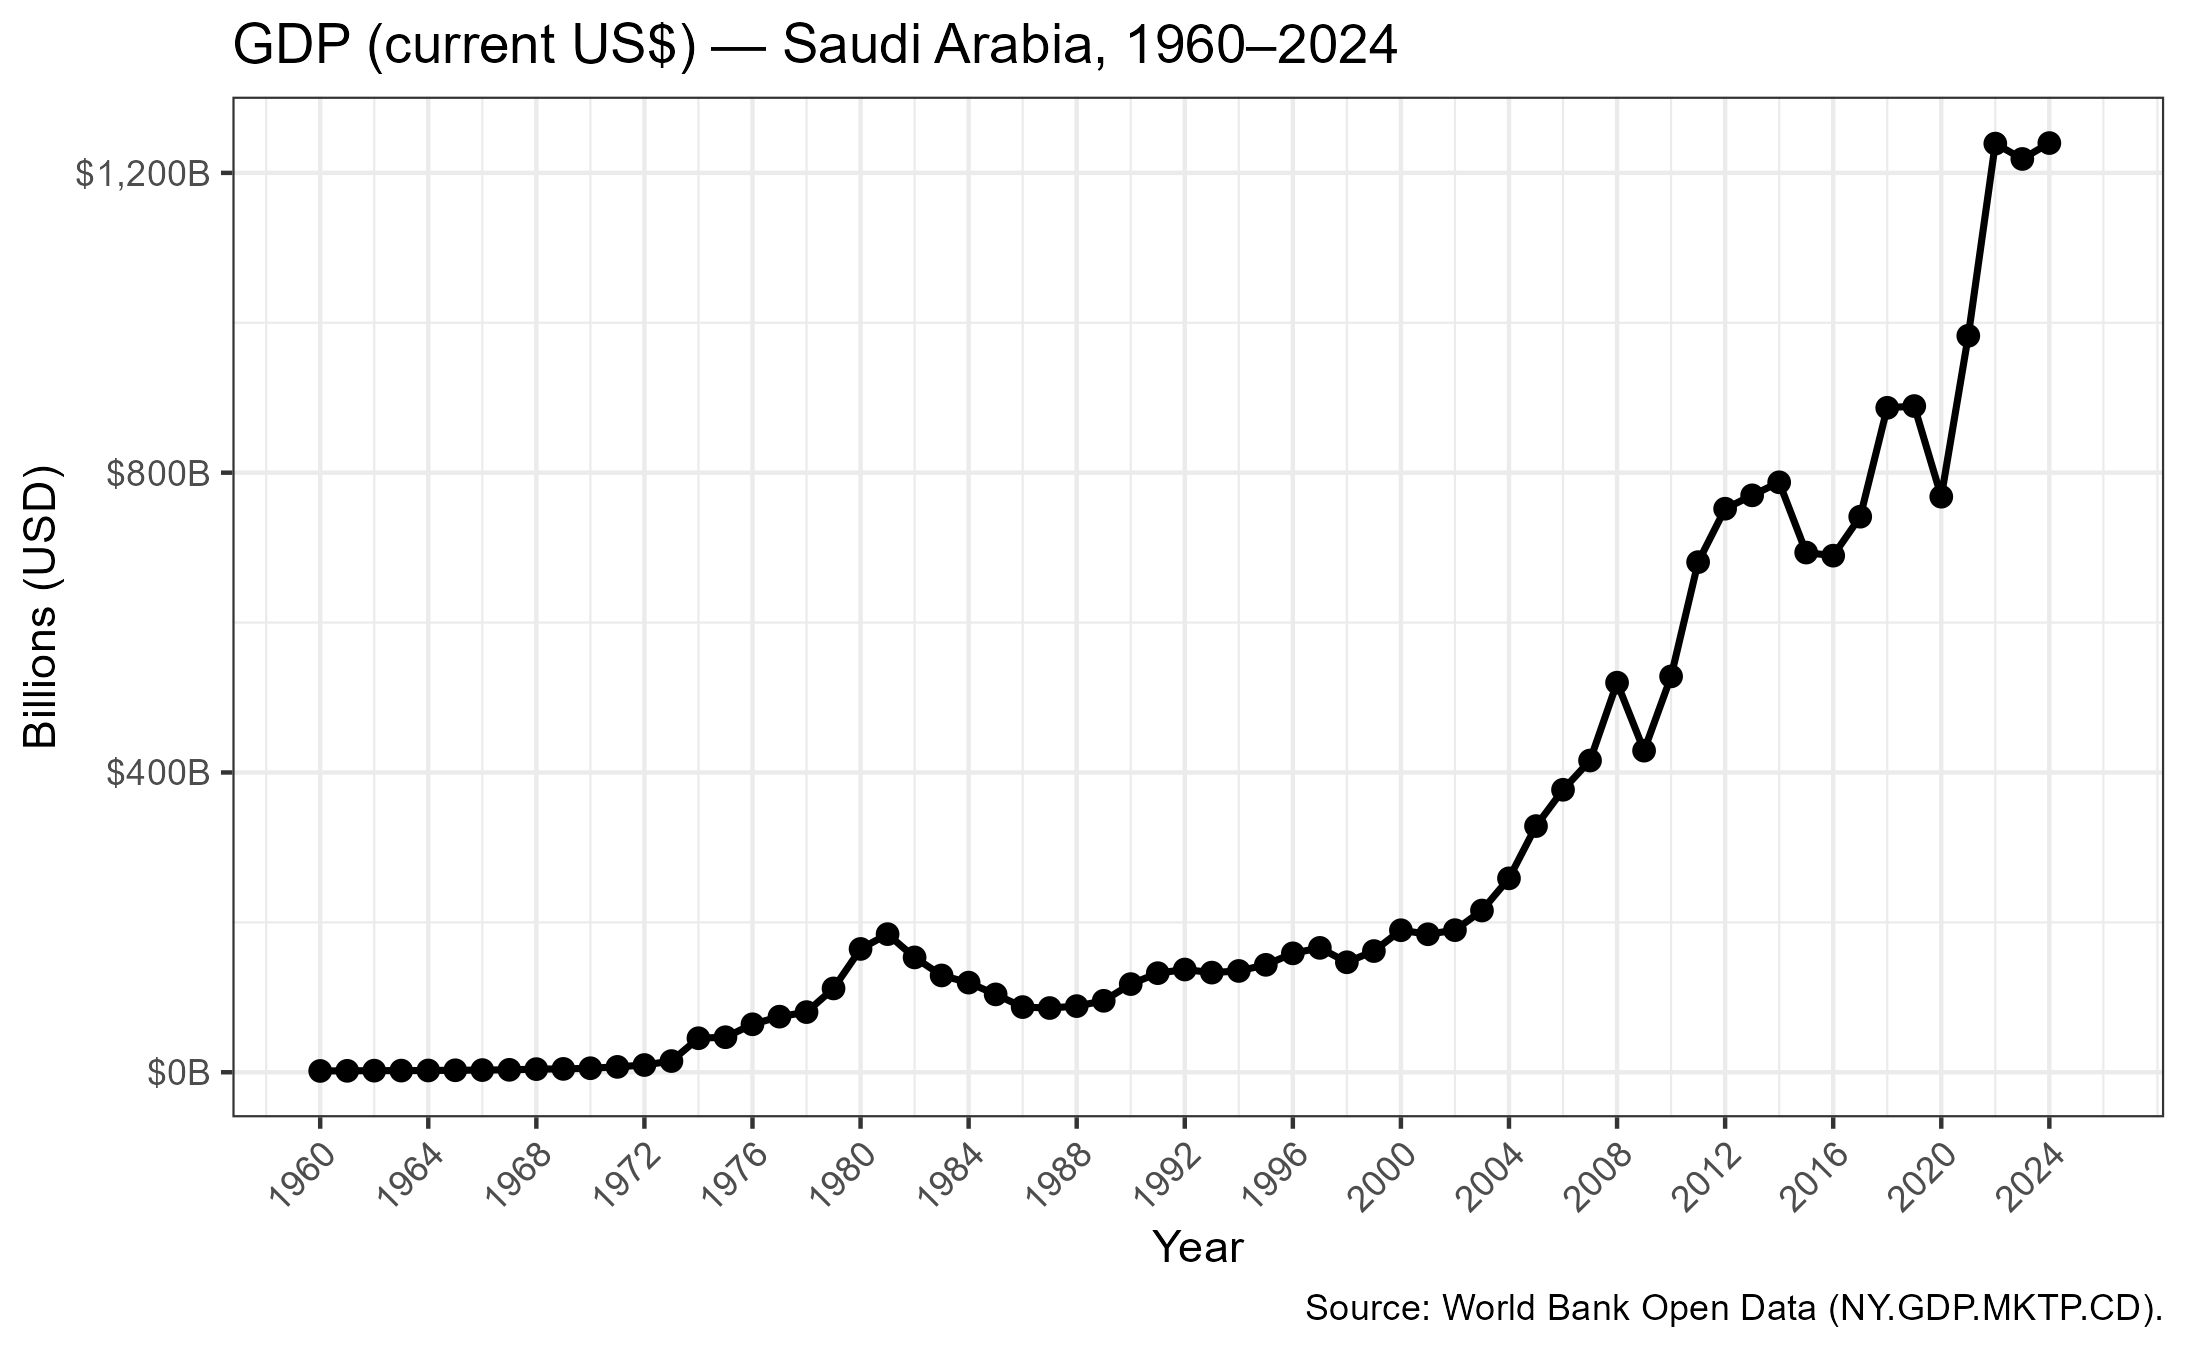
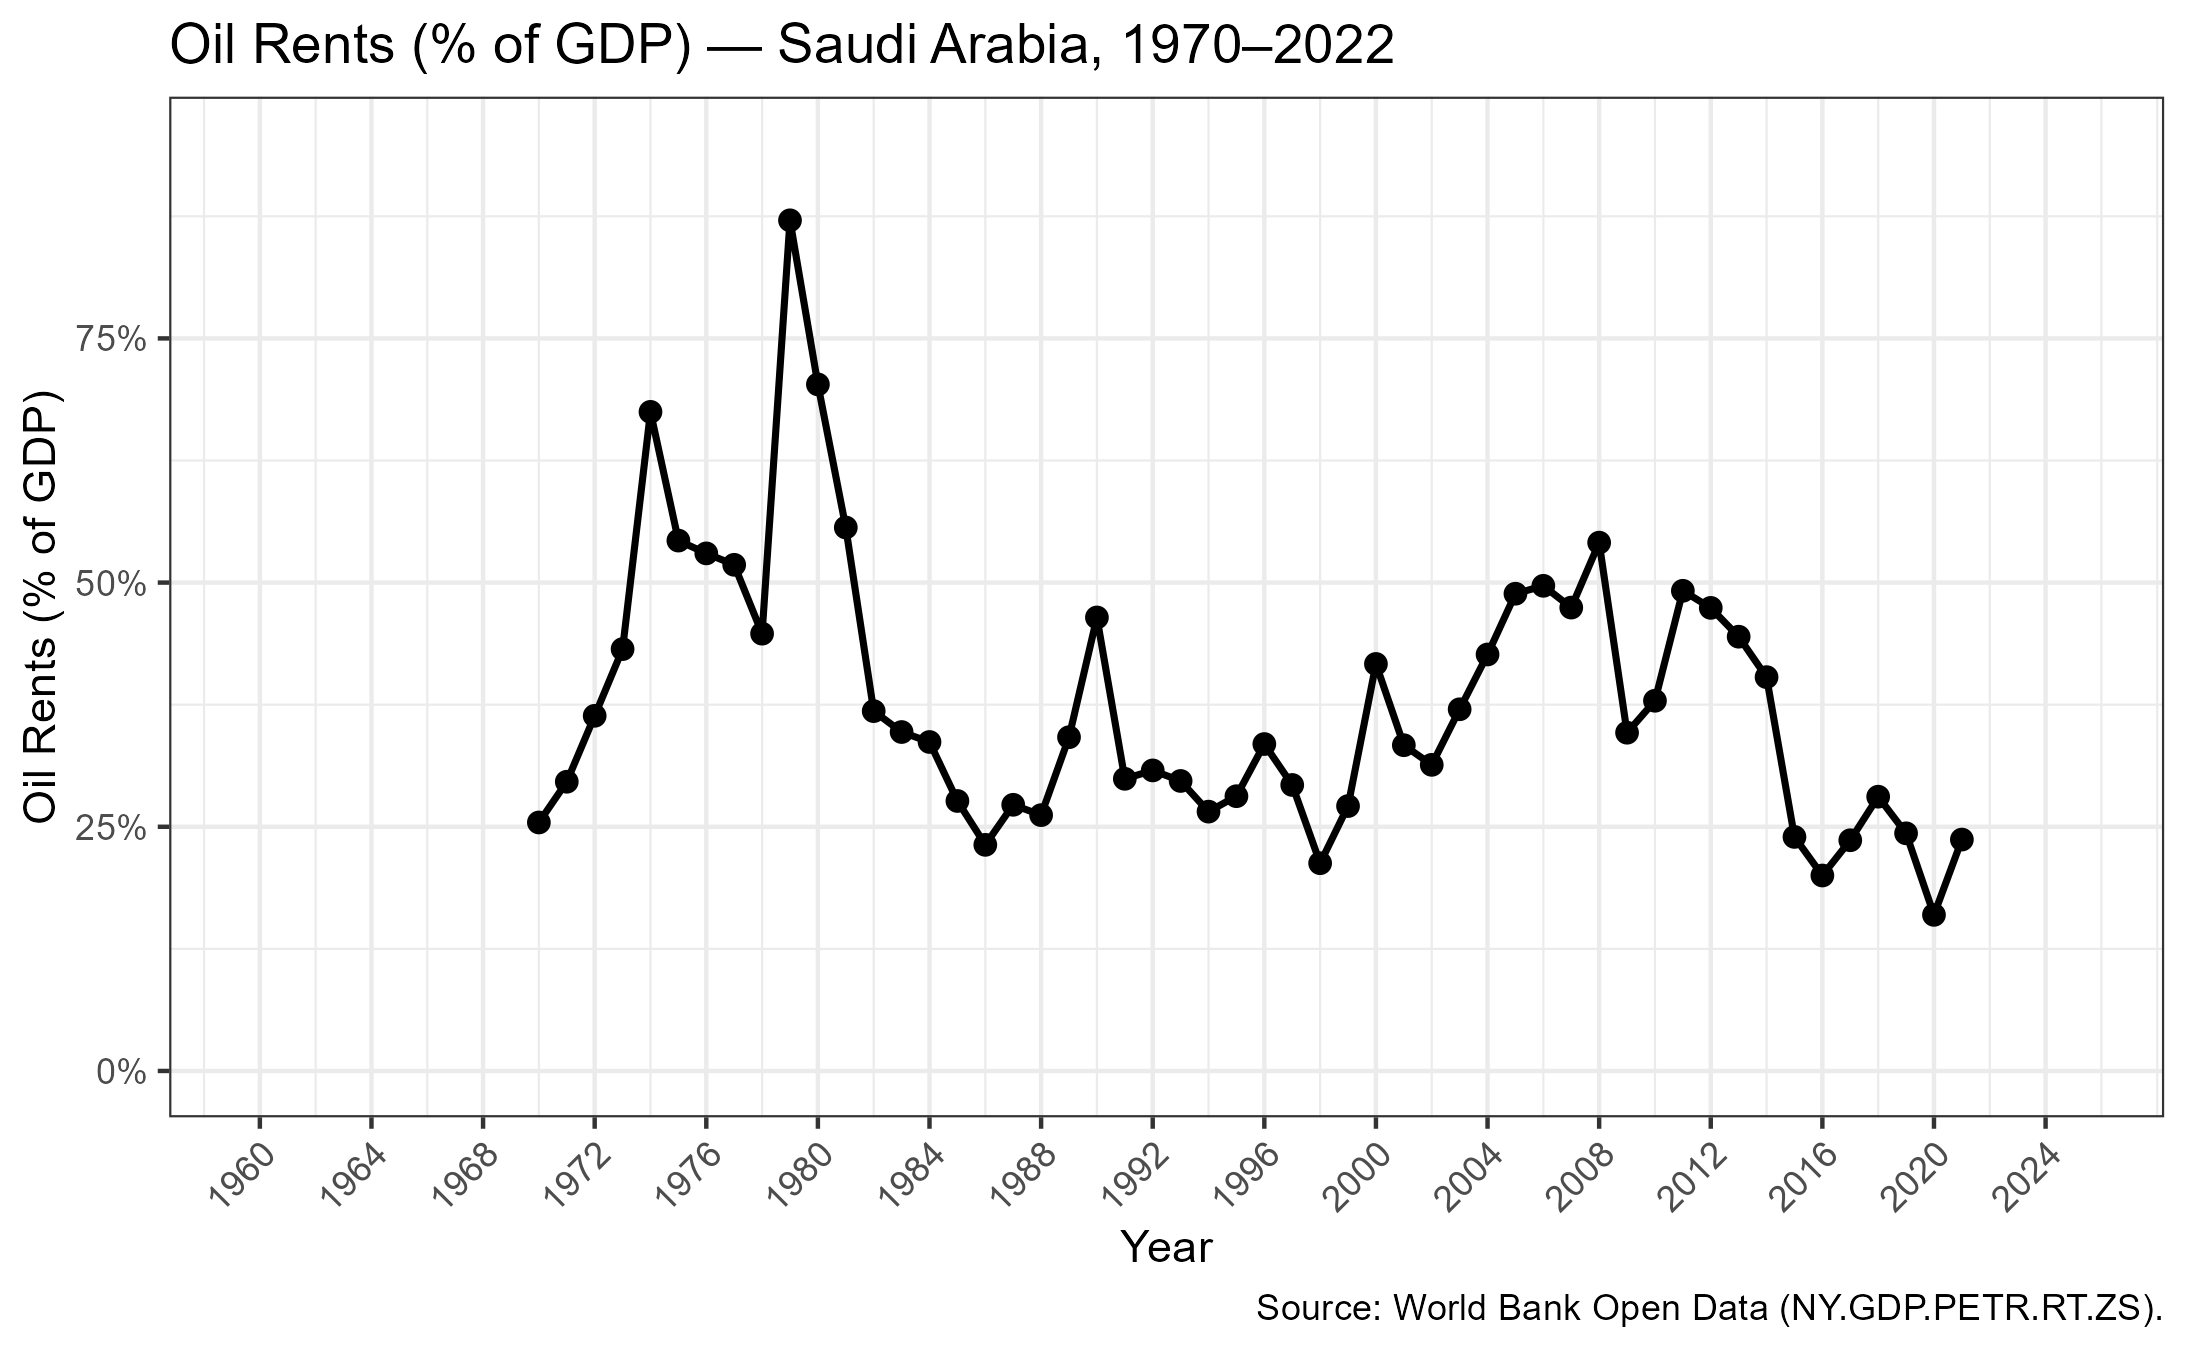
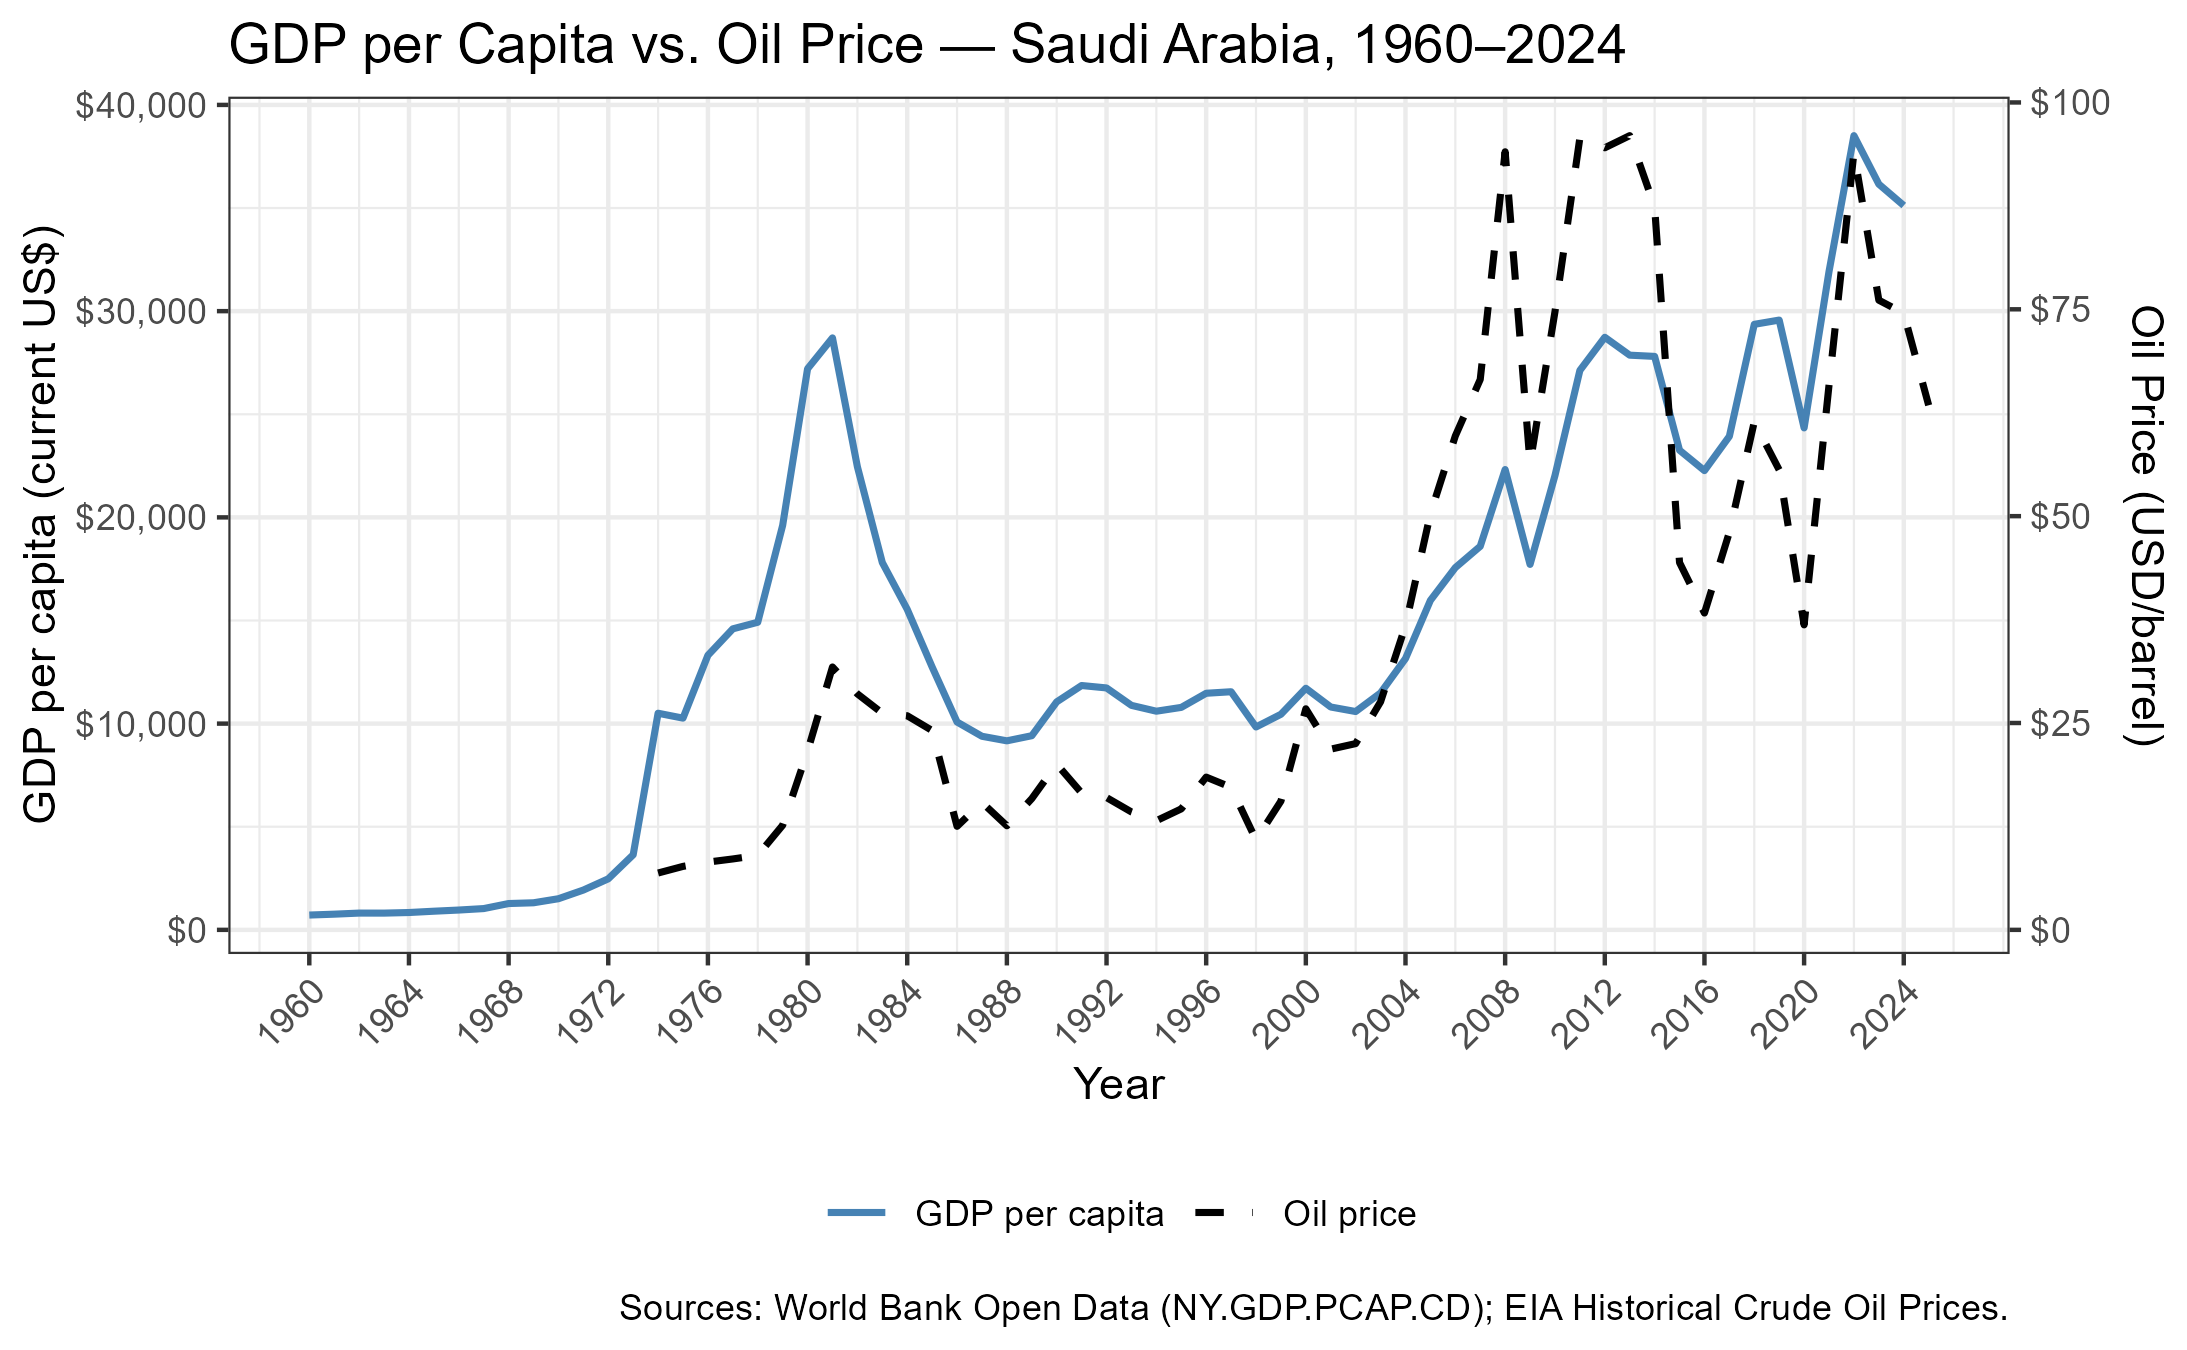
Saudi Arabia is a Middle Eastern powerhouse that sits on the Arabian Peninsula. With a GDP of over 1.27 trillion (2025) that places it top 20 in the world, Saudi Arabia is an extremely advanced economic nation known for their large supply of oil. Saudi Arabia possesses the second largest oil reserves in the world, and oil accounts for roughly 40% of the country’s GDP. The country tends to have a high percentage of volatility due to such a heavy reliance on oil, and its economic progress often reflects the success of oil at any given time. Saudi Arabia is a permanent and founding member of OPEC, and in recent years has worked with other members to reduce oil production in order to stabilize prices. Crown Prince Bin Salan has made a concerted effort to diversify and promote other sectors such as manufacturing, tourism, and technology, all in an effort to reduce the nation’s reliance on oil. The main challenge Saudi Arabia faces is that the country is often subject to oil price swings. There has also been an effort to increase female labor force participation, which has increased significantly in the last ten years, but is still much lower than the world average.
MACROECONOMIC INDICATORS
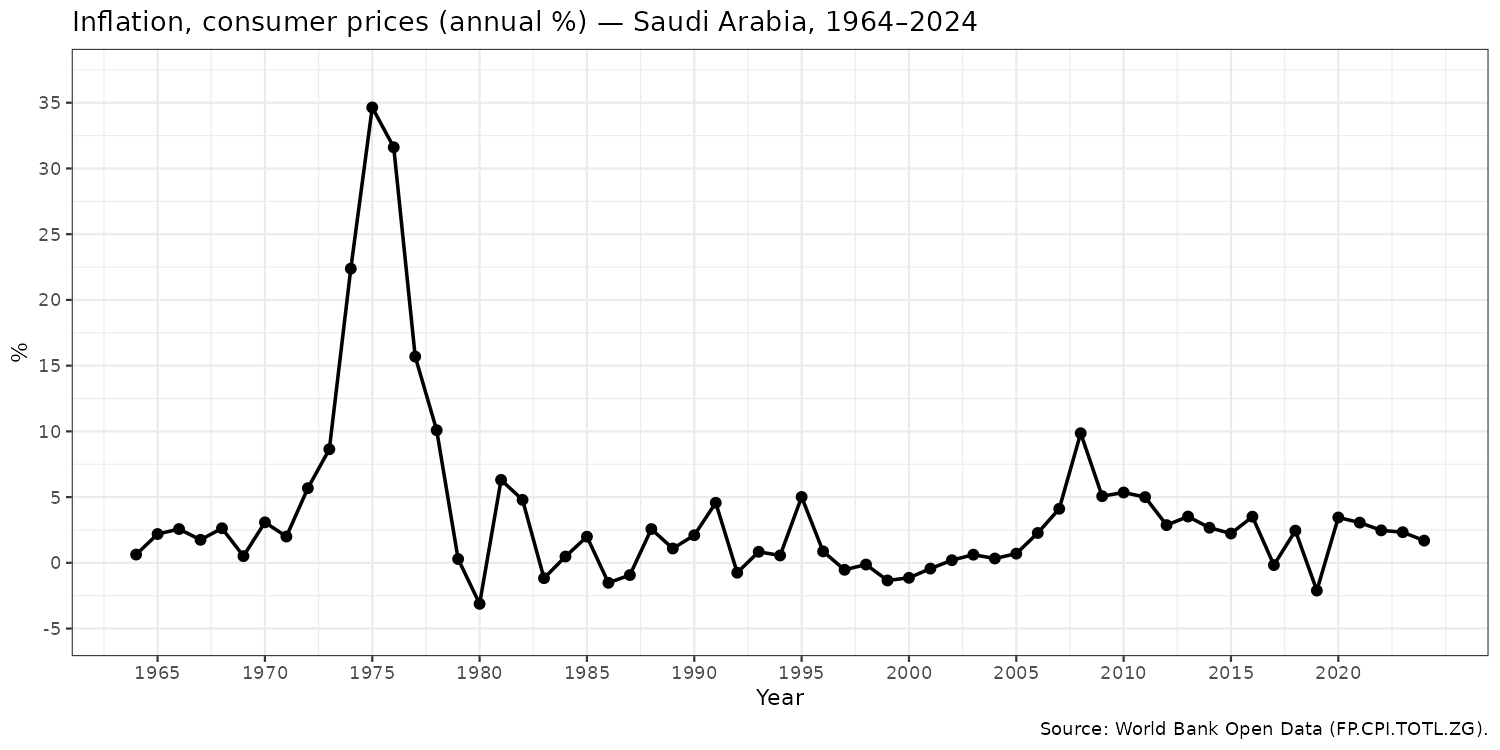
The most dramatic feature of the inflation graph is the sharp spike in the mid 1970s with the inflation peaking at about 35 percent in 1975 (Alsharari 2023). This was primarily caused by the oil boom or the 1973 oil price shock. As oil prices skyrocketed, there was a massive increase in oil revenues and Saudi Arabia’s government spending increased massively. The underdeveloped financial market and the structural rigidities such as bottlenecks in the form of skilled labor shortage, limited industrial capacity, and limited agricultural resources prevented an equivalent increase in production and were responsible for inflationary pressure (Alsharari 2023). Following this, the oil revenues falling led to a decrease in aggregate demand and in the eighties and nineties the rate of inflation fell, with some years showing deflation rates. The graph shows low and stable inflation from the 1990s until early 2000s. Their most recent spike/shock is in 2008 with the inflation rising to 9.9 percent. This was mainly because of rising food and housing costs coupled with expansionary fiscal policies (Alsharari 2023). The inflation rate has decreased from 2008 till 2020 because of several reasons, such as the government’s responses and the global financial crises.
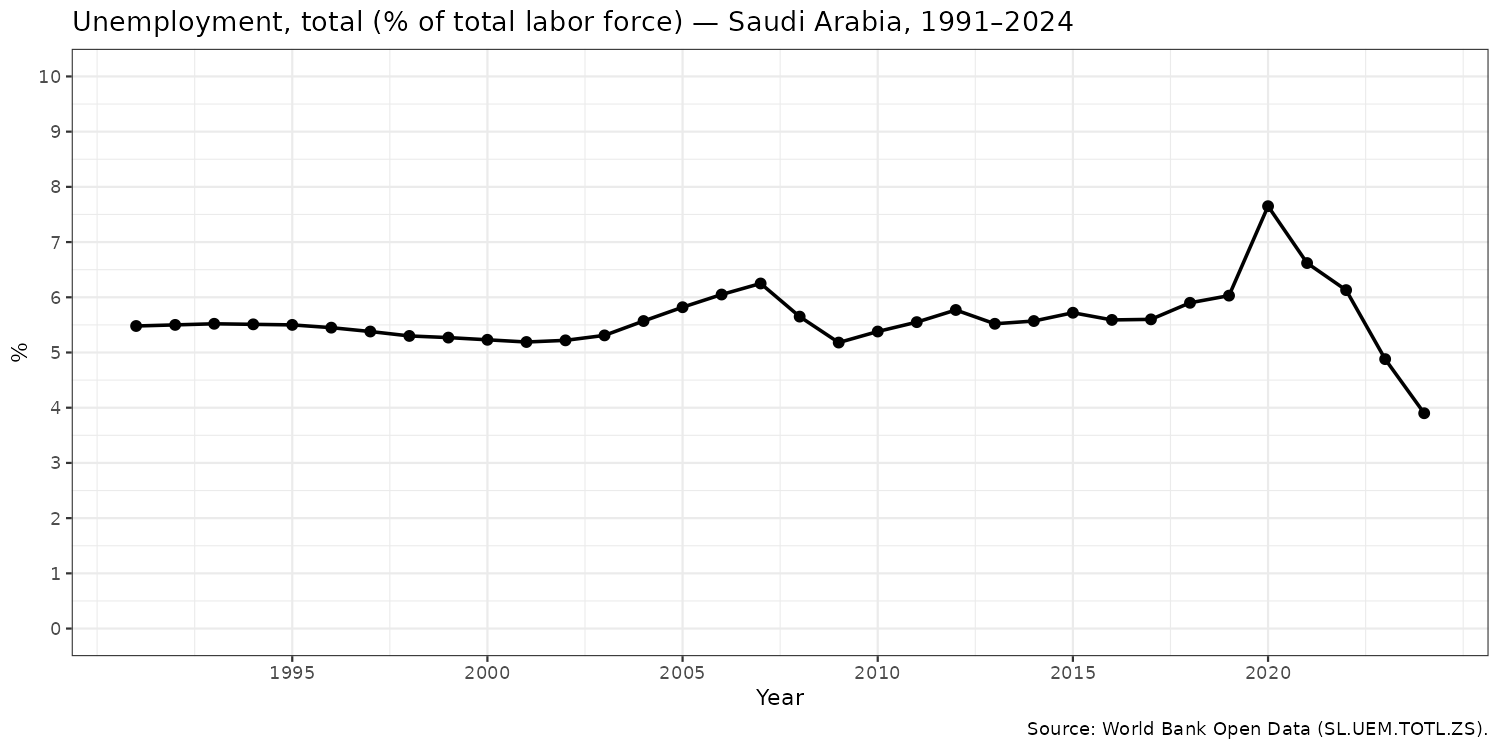
Saudi Arabia’s unemployment rate has largely followed global trends, with a moderate decline in the late 90’s, early 2000s as the internet fostered growth in non-oil sectors. Unemployment, however, was relatively stable during the Great Recession due to high oil prices. Understandably, the country also faced a spike in unemployment during the COVID 19 recession, but has quickly recovered with the rate of unemployment falling to its lowest level in over 30 years.
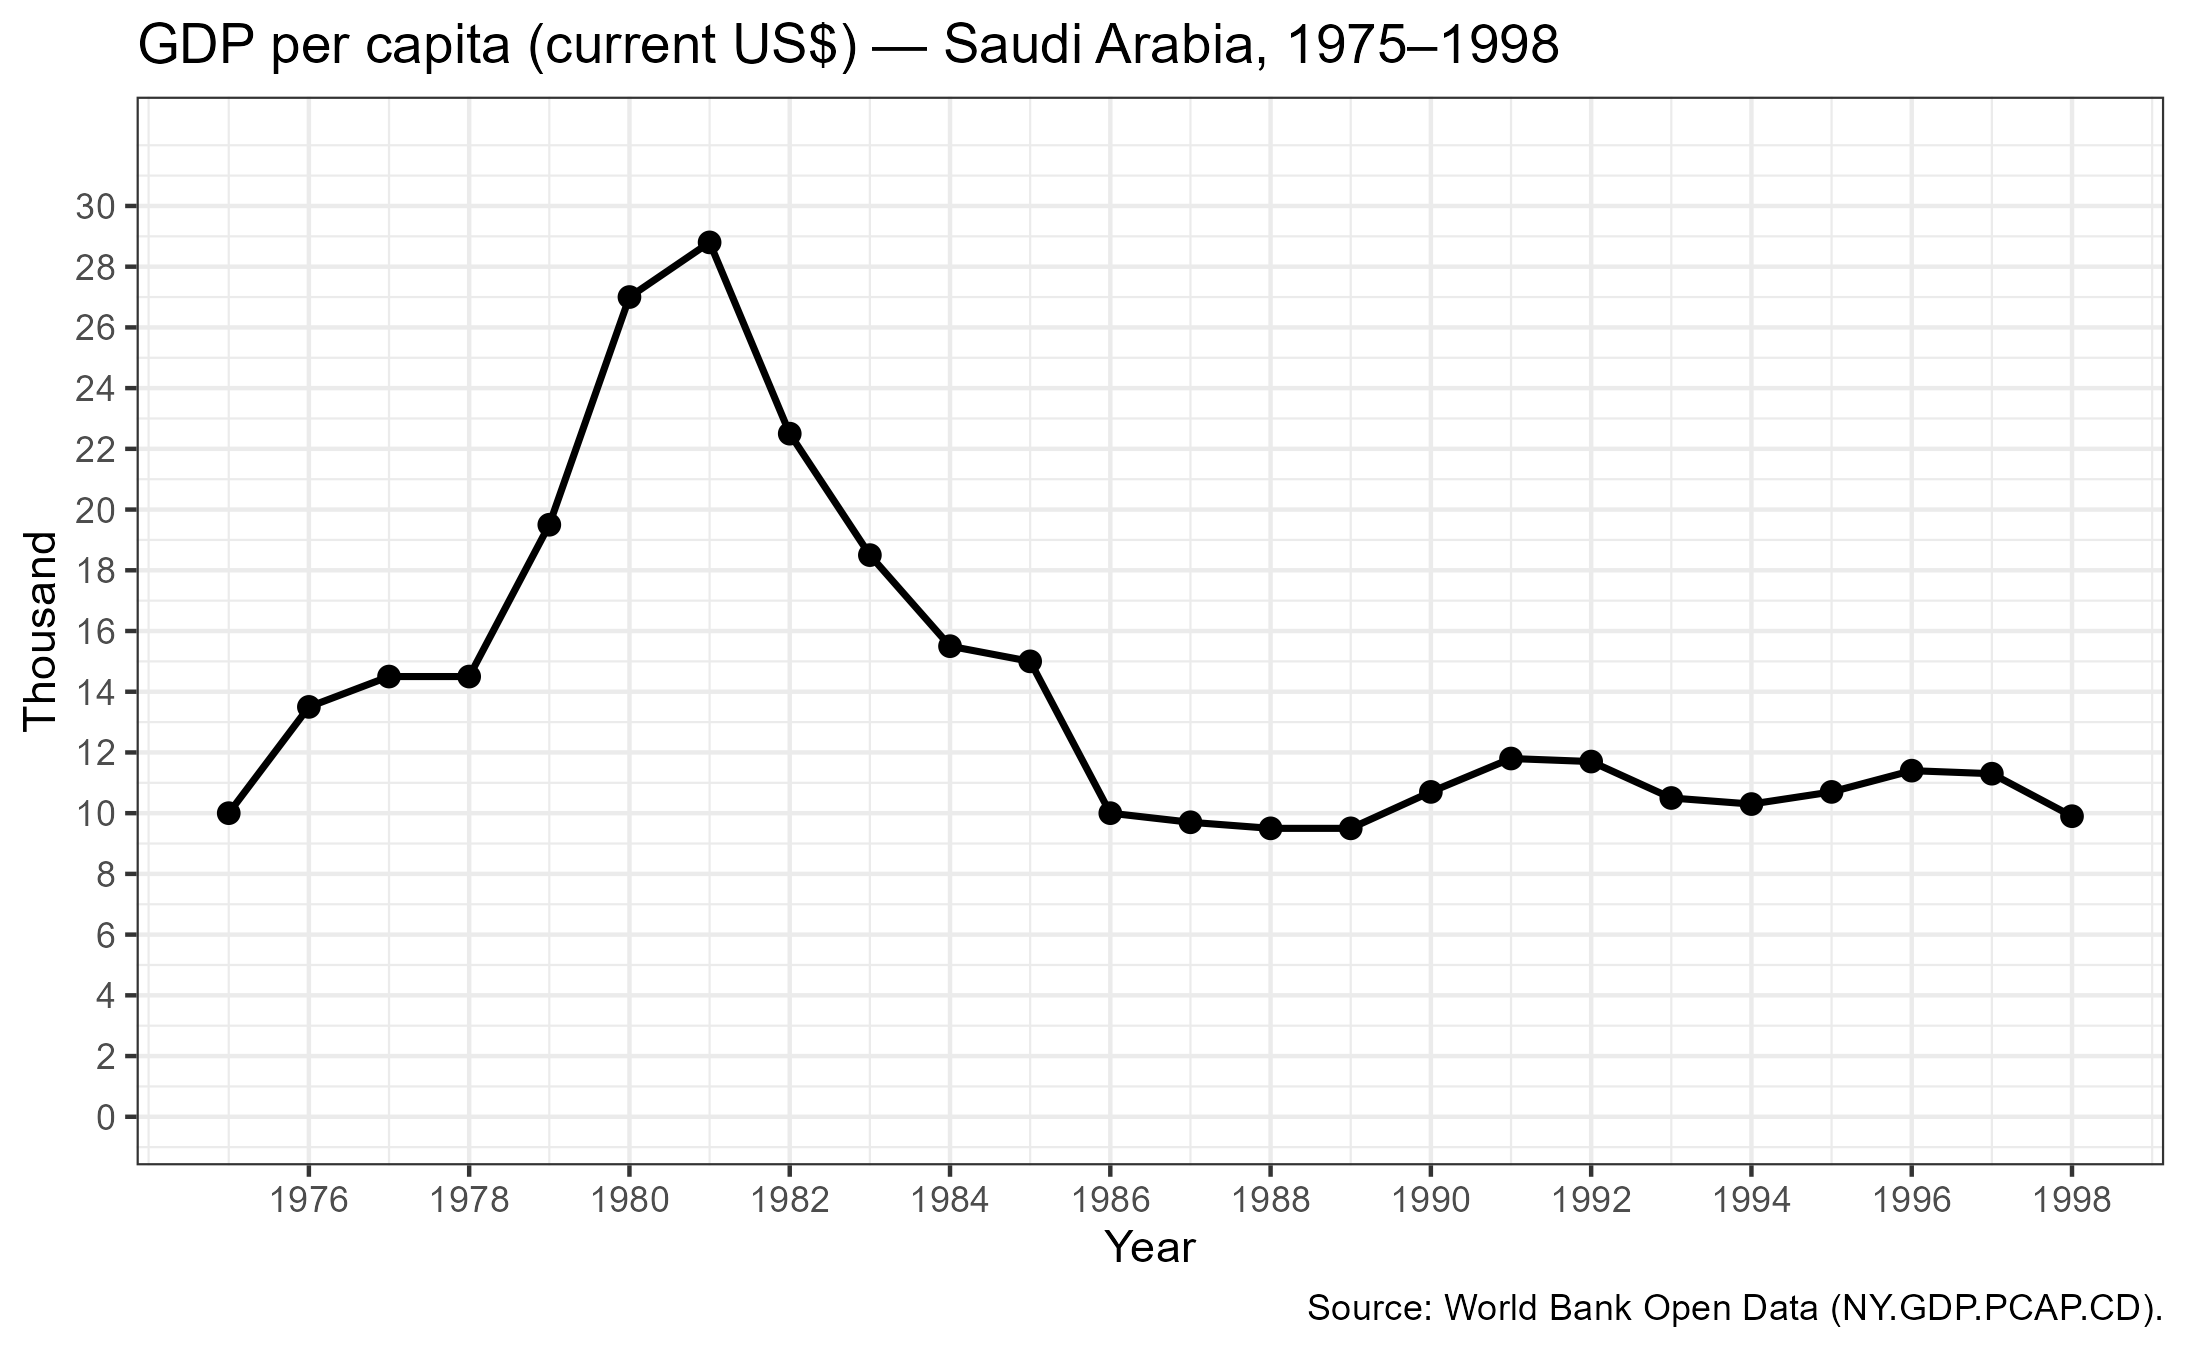
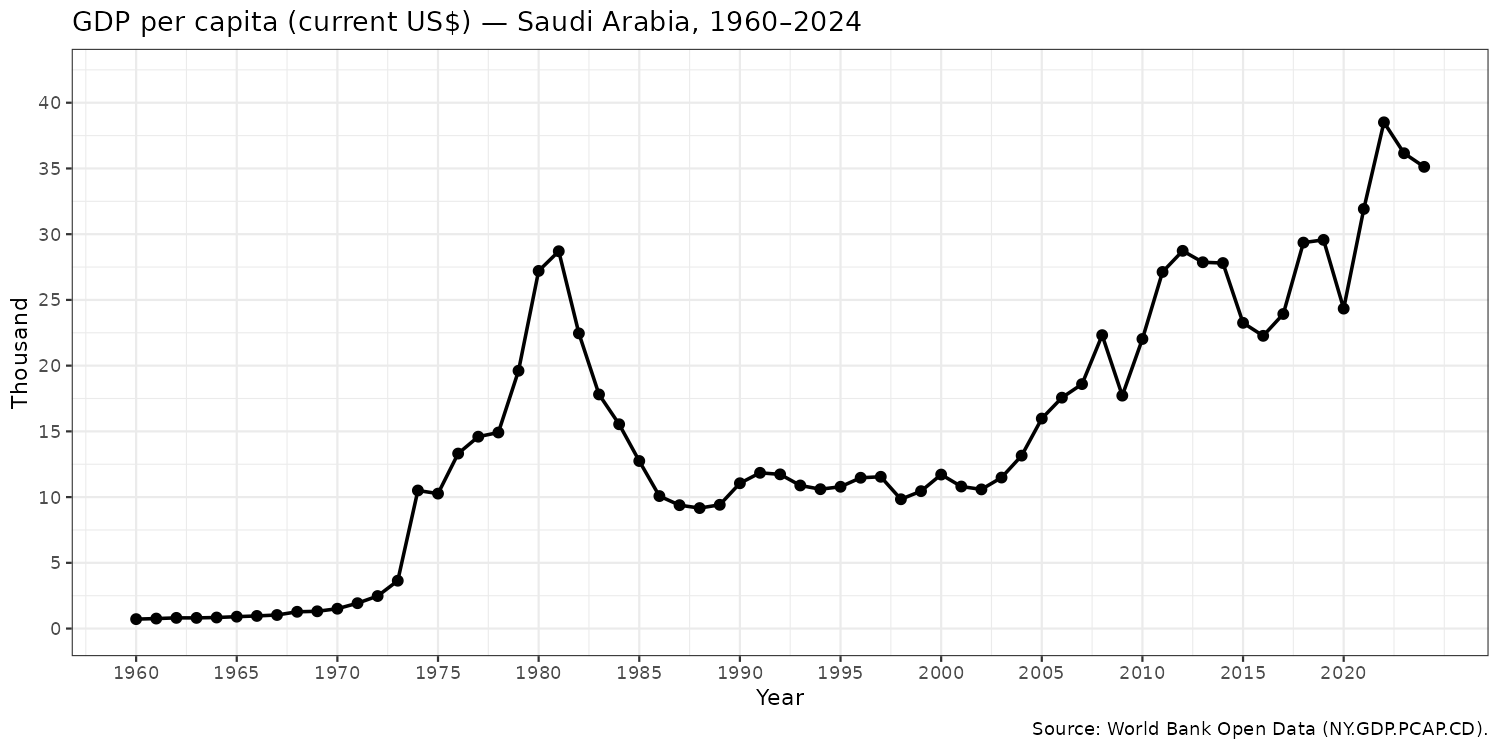
Evidence from the graph suggests that Saudi Arabia’s GDP per capita reflects volatile fluctuations over time often dependent on global energy prices and oil exports.
In the 1970s, following the 1973 oil crisis, oil prices rose significantly leading to a sharp rise in the country’s GDP per capita (Gibs, 2024). This oil boom helped increase government revenues as well as national income. However, soon after it followed the mid 1980s oil price collapse. GDP per capita fell dramatically and roughly remained at the level throughout the late 1980s and 1990s. Beginning in the early 2000s, we can see another significant increase in the macroeconomic indicator likely due to stronger demands and higher oil prices. Unsurprisingly, we see a decline later in 2020 due to the global pandemic crisis which led to reduced global energy demand. GDP per capita rebounded in 2022 as oil prices surged, reaching one of the highest levels in the country’s history, and then moderating slightly. This trend of alternating levels of GDP is indicative of its dependence on oil and energy demands.
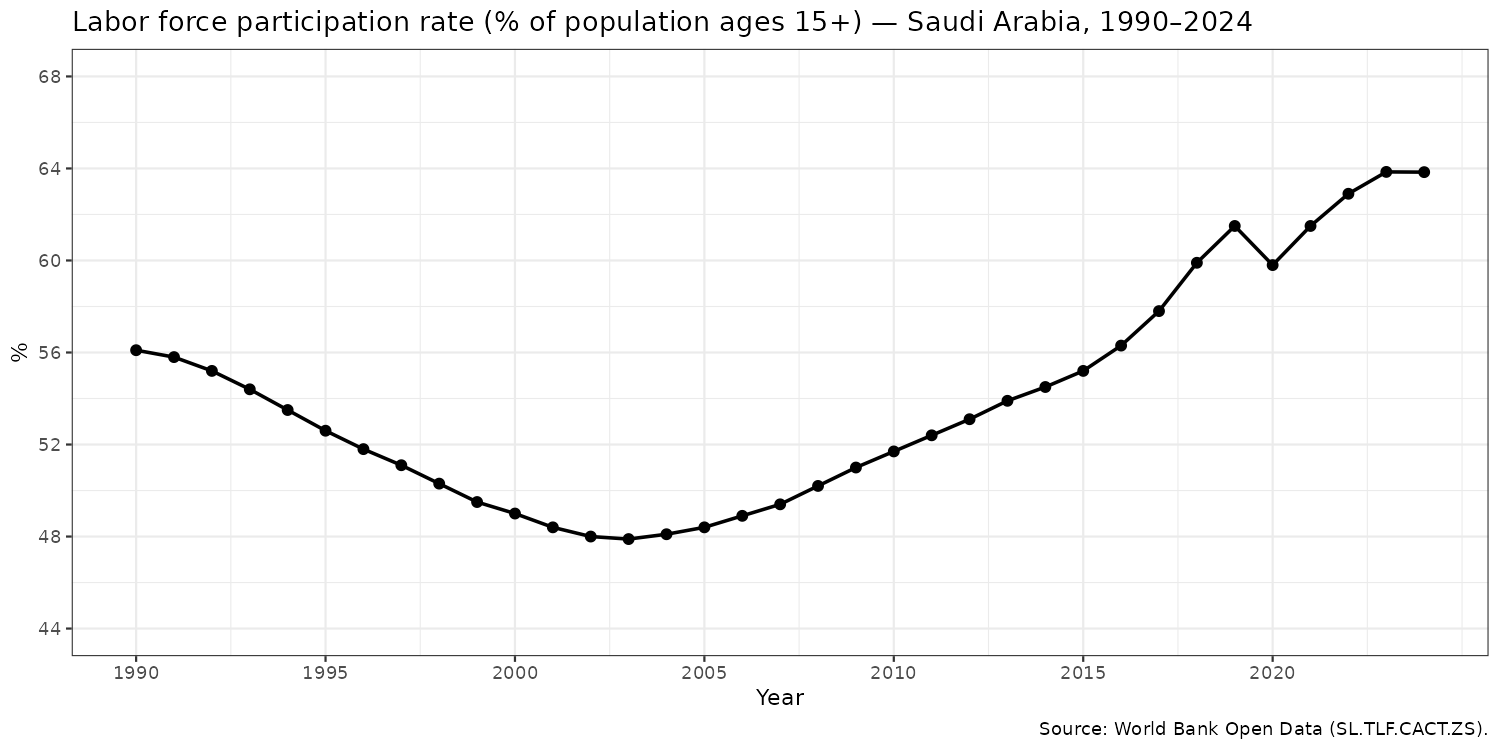
Saudi Arabia’s total labor force has grown steadily over the past decades, rising from approximately 50 million workers in the late 1990s to about 65 million in recent years. The most rapid surge in employment occurred between 2005 and 2015, a time highlighted by expansion of the private sector, higher oil revenues, and investments. Constructions, services, and energy related industries employed both domestic and foreign labor. A noticeable decline is evident around 2017-18 driven by changes in policy under vision 2030, reduction in the number of foreign labor, and lower oil prices (IMF, 2018). Overall, the general upward trend of labor force participation shows strong population growth, and economic expansion. However, sustaining this could pose a challenge as Saudi Arabia works on diversifying away from oil and also encouraging labor participation among the female and youth population.
MACROECONOMIC POLICIES
POLICY 1: VAT Introduction Policy
Value Added Tax (VAT) in Saudi Arabia is a broad-based consumption tax levied at 15 percent on most goods and services. It was introduced in January 2018 at 5 percent and tripled to 15 percent in July 2020 as a cornerstone of the Kingdom’s non-oil revenue strategy. The decision underscored the Kingdom’s vulnerability to hydrocarbon revenue volatility and accelerated the shift toward taxation as a sustainable revenue source.
Model-Based Analysis and Predictions
VAT increases the final price of goods and services which lowers consumption, hereby, shifting the AD curve to the left. This results in a lower equilibrium level of real output (GDP) and downward pressure on inflation.
AD = C + I + G + (X − M)
Hence, the decrease in consumption pushes down the AD curve.
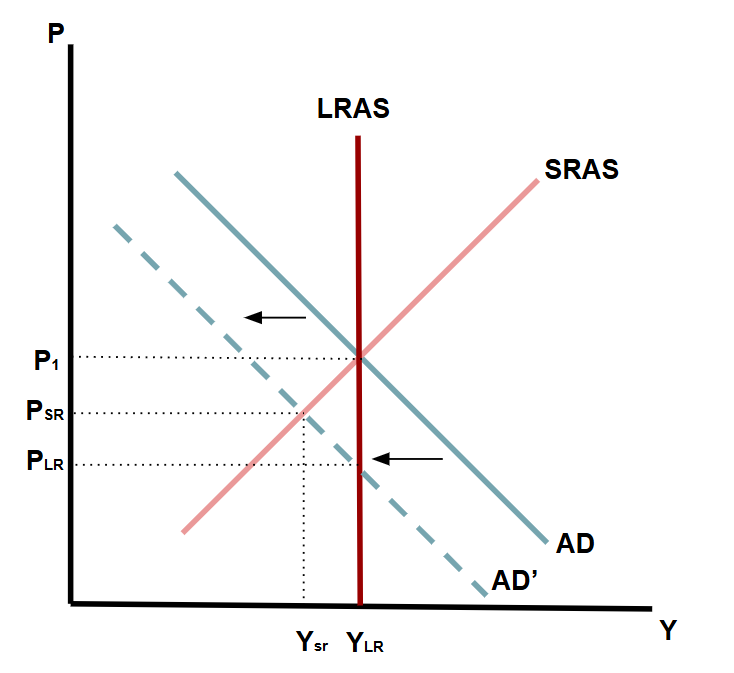
Figure 1: AD-AS curve. AD shifts to the left due to lower consumption.
The IS curve moves left as well due to the decrease in consumption. However, due to the fall in Prices, the LM curve would shift outwards or towards the right. The long run movement of the LM offsets the leftward shift in IS. This means long run output remains the same but long run interest rate is lowered. Investment rises due to decrease in interest rates and the rise is higher for the long run as compared to the value of investment in the short run.
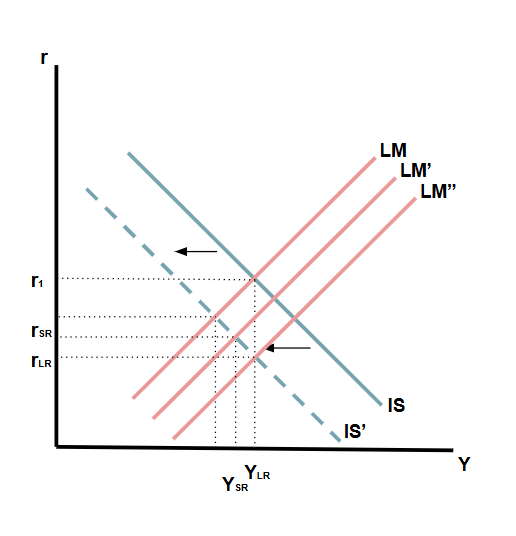
Figure 2: IS-LM curve. IS shifts to the left due to lower consumption. LM shifts right due to fall in Prices
P falls in SR but Pᵉ is fixed. So W/P rises (the nominal wage is sticky but prices dropped, so real wages go up). Firms face higher real labor costs and therefore, hire lesser. Unemployment rises. This is a painful short-run consequence Saudi Arabia accepted in 2020, mid-COVID, when the VAT tripling hit. In the long run, the model predicts the real wage to move back to the initial level due to adjustment of price expectations. This will also return the employment level to its natural level.
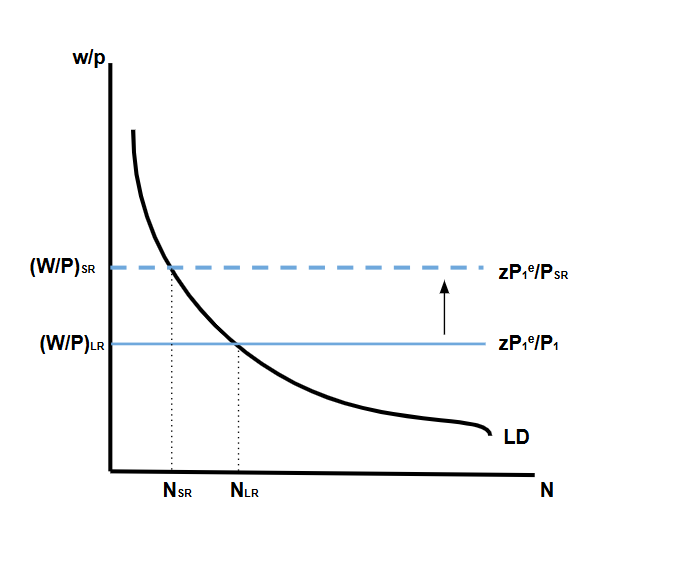
Figure 3: Labor Market curve. Real wage rises in the short run. Unemployment rises.
Comparison with Real Economic Outcomes
Since consumption is a major component of GDP and consumption falls, we predict from the AD-AS analysis the GDP growth to fall. This theoretical prediction aligns with the observed data. The World Bank data graph shows a sharp decline in GDP growth between 2018 and 2020 which is consistent with a reduction in aggregate demand. While the AD–AS model correctly predicts that an increase in VAT can reduce GDP growth through lower consumption, the magnitude of the observed decline between 2018 and 2020 likely reflects both policy effects and external shocks. The sharp increase in GDP growth following 2020 is interesting because the VAT was tripled then. The opposite is observed in real world data probably due to external shocks like oil recovery.
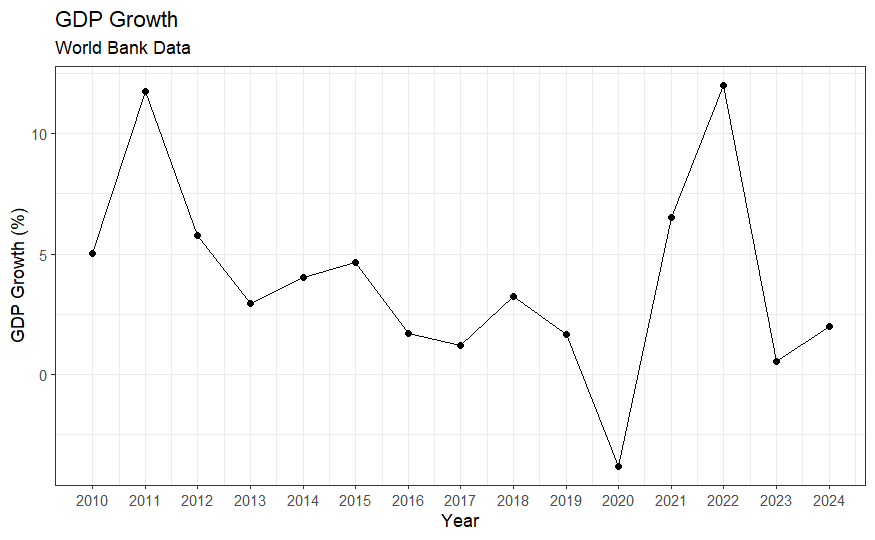
Source: World Bank Open Data (NY.GDP.MKTP.KD.ZG)
VAT directly increases price levels so we expected a sharp spike in inflation. However, real world data shows a fall in inflation from 2018 to 2019 followed by a sharp spike from 2019 to 2020. The rate being tripled in 2020 also doesn’t seem to cause an upward spike later. This goes against what we predicted. Inflation is strongly influenced by external shocks, particularly changes in global oil prices and demand conditions. The sharp fall in consumption and economic activity due to the pandemic could have potentially offset potential inflationary pressure from the VAT.
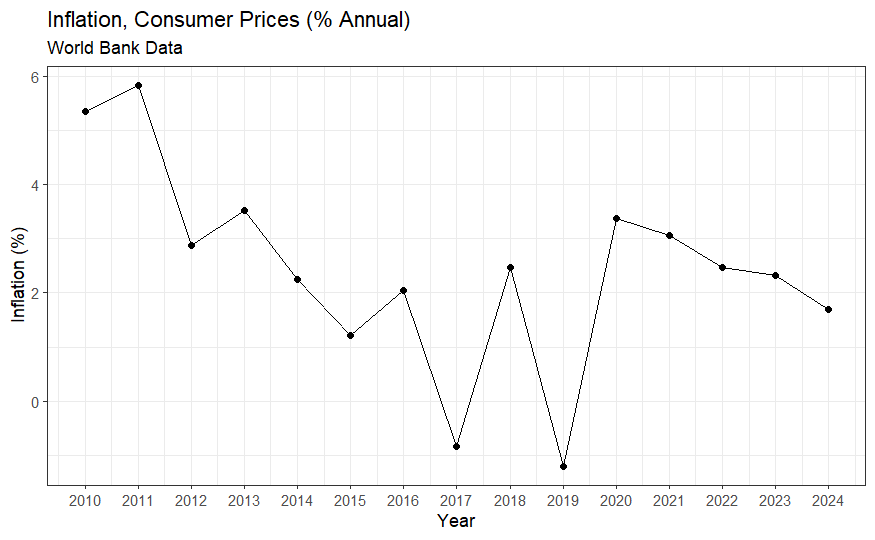
Source: World Bank Open Data (FP.CPI.TOTL.ZG)
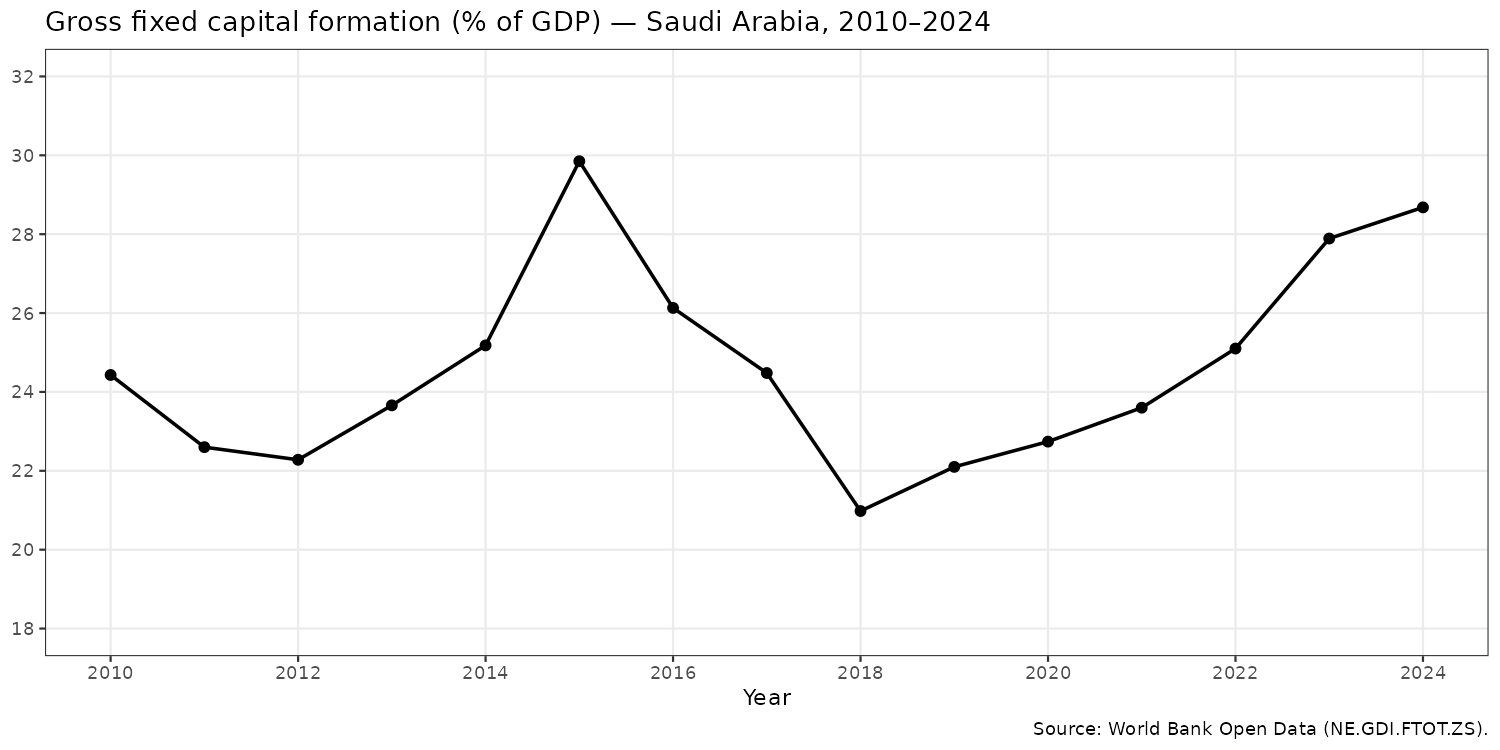
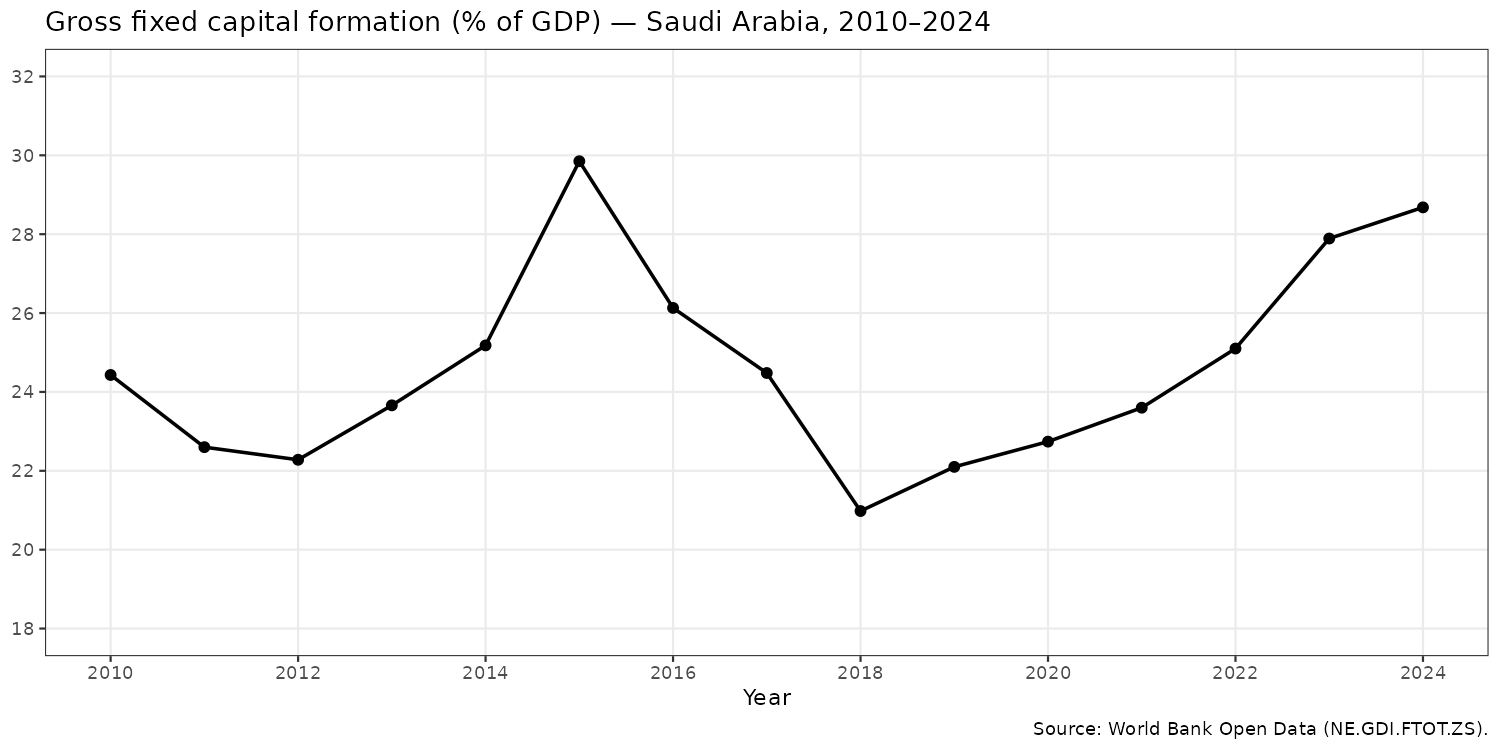
Decrease in interest rates would have led to a increase in investments. The graph based on real world collected data agrees with the predictions made from the AD-AS showing an incline in investment which is maintained steadily following 2018.
Interpretation
The effect of implementing the VAT can be viewed as a contractionary fiscal policy, as it causes price increases, leading to lower levels of consumption. It would lead to a leftward shift in the aggregate demand, resulting in reduced output. Based on the IS-LM analysis, there should be an expected leftward shift of the IS curve, leading to lower levels of income and employment. Furthermore, it would be associated with higher inflation rates because of the increase in the price level.
According to the data, GDP growth was observed to fall between 2018 and 2020, thus supporting the predictions of the model. The level of investment decreased as well. Inflation, however, did not respond as predicted, dropping at first but then rising in 2020 and not experiencing any further increases, despite the threefold rise in the VAT rate. The reasons behind the non-conformity can include the existence of overlapping economic events, such as the COVID-19 outbreak that led to lower demand, and thus lower inflation rates. The effect of lower consumer expectations and spending can contribute to this phenomenon as well. The AD-AS model assumes a static approach towards taxation, failing to take into account behavioral changes or external factors.
POLICY 2: Vision 2030 Policy Program
Saudi Arabia was hit hard by the price crash of oil in 2014-2016, due to its large dependency on the resource. This caused a large budget deficit, and prompted Crown Prince Mohammed bin Salaman to initiate this policy aimed at diversification away from oil by increasing public spending on infrastructure, education, healthcare, and tourism.
Model Based Analysis and Predictions
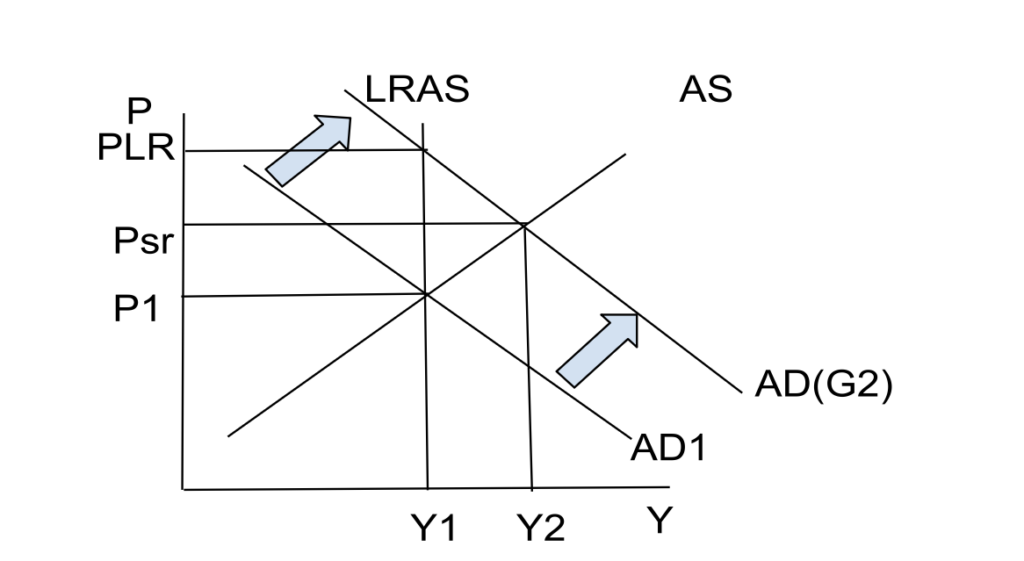
Figure 4: AD-AS model. An increase in Government spending (G) shifts AD curve to the right.
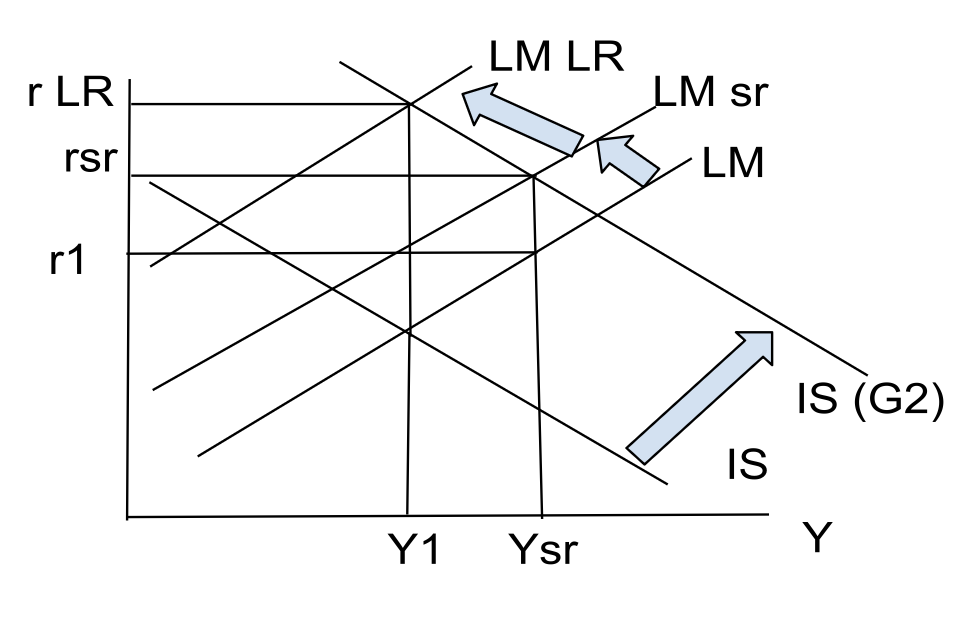
Figure 5: IS-LM curve. IS shifts out to the right and LM shifts to the left.
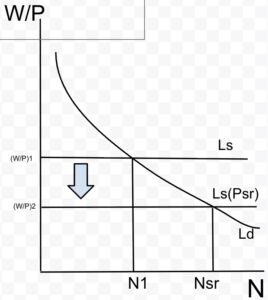
Figure 6: Labor Market Diagram. Labor supply decreases due to the price level increase.
Comparison with Real Economic Outcomes
Since government expenditure influences GDP, we predict from the AD-AS analysis that GDP growth should rise. This theoretical prediction aligns with the observed data. The World Bank data graph shows an increase in GDP growth after 2016 which reflects an increase in aggregate demand. 
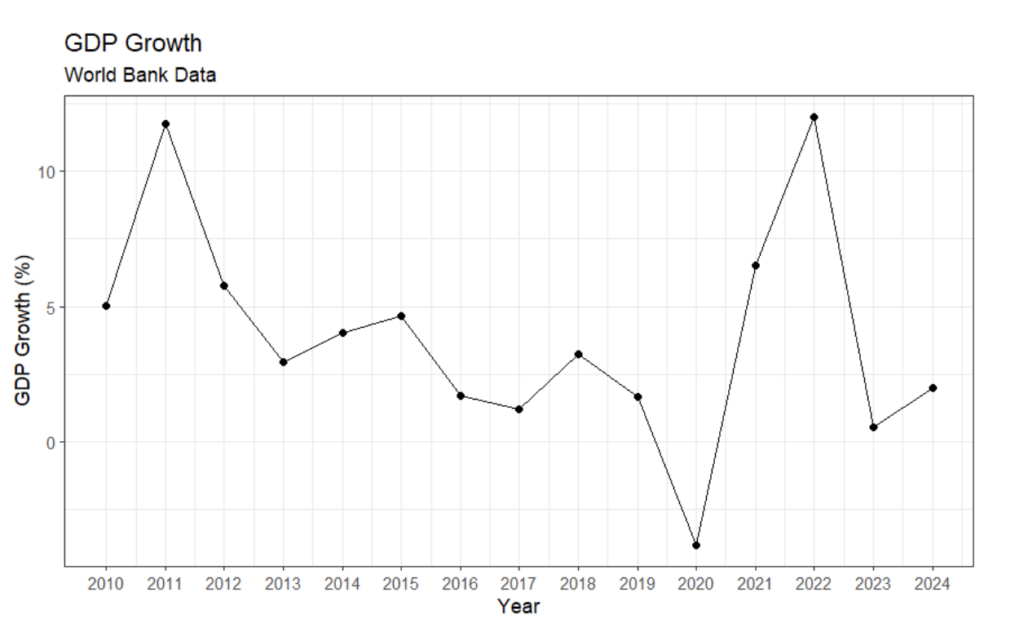
Source: World Bank Open Data (NY.GDP.MKTP.KD.ZG)
We expected inflation to rise as a result of the increase in aggregate demand. However, real world data does not reflect as such. Inflation seemed to drop after 2016.
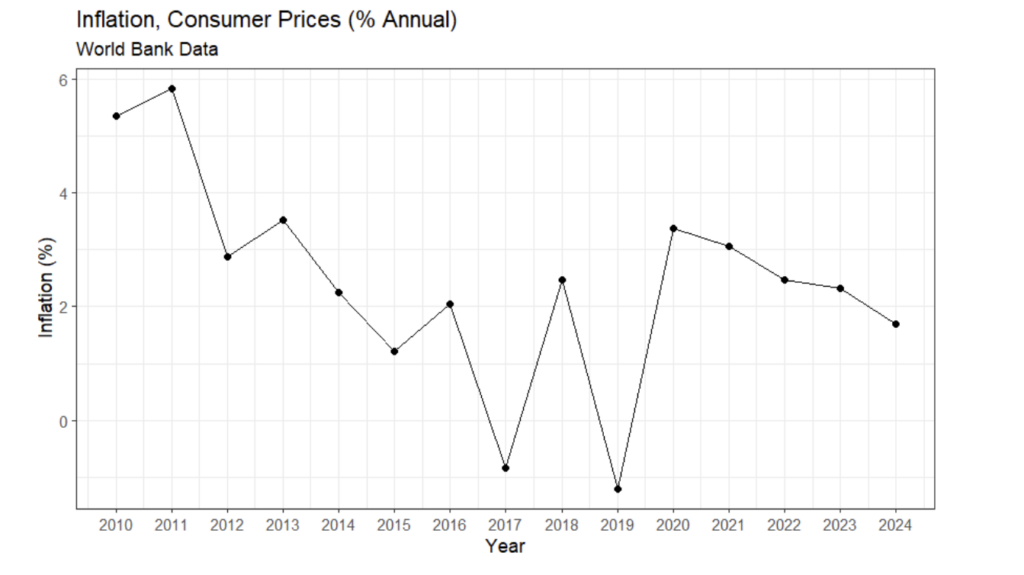
Source: World Bank Open Data (FP.CPI.TOTL.ZG)
We expected investment to decrease in the short run due to the IS curve shifting right and rising interest rates which makes borrowing more expensive. Real world data reflects our expectations accurately. We see a massively sharp decline in investment after 2015.
Interpretation
Vision 2030 can be viewed as an expansionary fiscal policy since more government expenditure would lead to a rightward shift in the aggregate demand curve, resulting in higher production levels and higher inflation in the short term. Additionally, according to the IS-LM framework, a rightward shift in the IS curve would lead to higher income levels and interest rates, thus crowding out private investments and reducing foreign direct investments. Nonetheless, the real-world situation partially matches with this framework, as GDP growth did not rise and instead dropped in 2017, while unemployment and inflation fell.
The differences could be accounted for by the lags in implementation, the nature of the Saudi Arabian economy, and external shocks. Large-scale programs like Vision 2030 plan take some time before impacts are felt due to the economy’s heavy reliance on oil production, which is vulnerable to changes in prices around the world. Uncertainty about the plans could also have kept private investors away, leading to the continued fall in FDI. However, AD–AS and IS–LM models correctly project the direction of the long-term impacts, though they miss out on other aspects.
THE 1986 OIL PRICE COLLAPSE
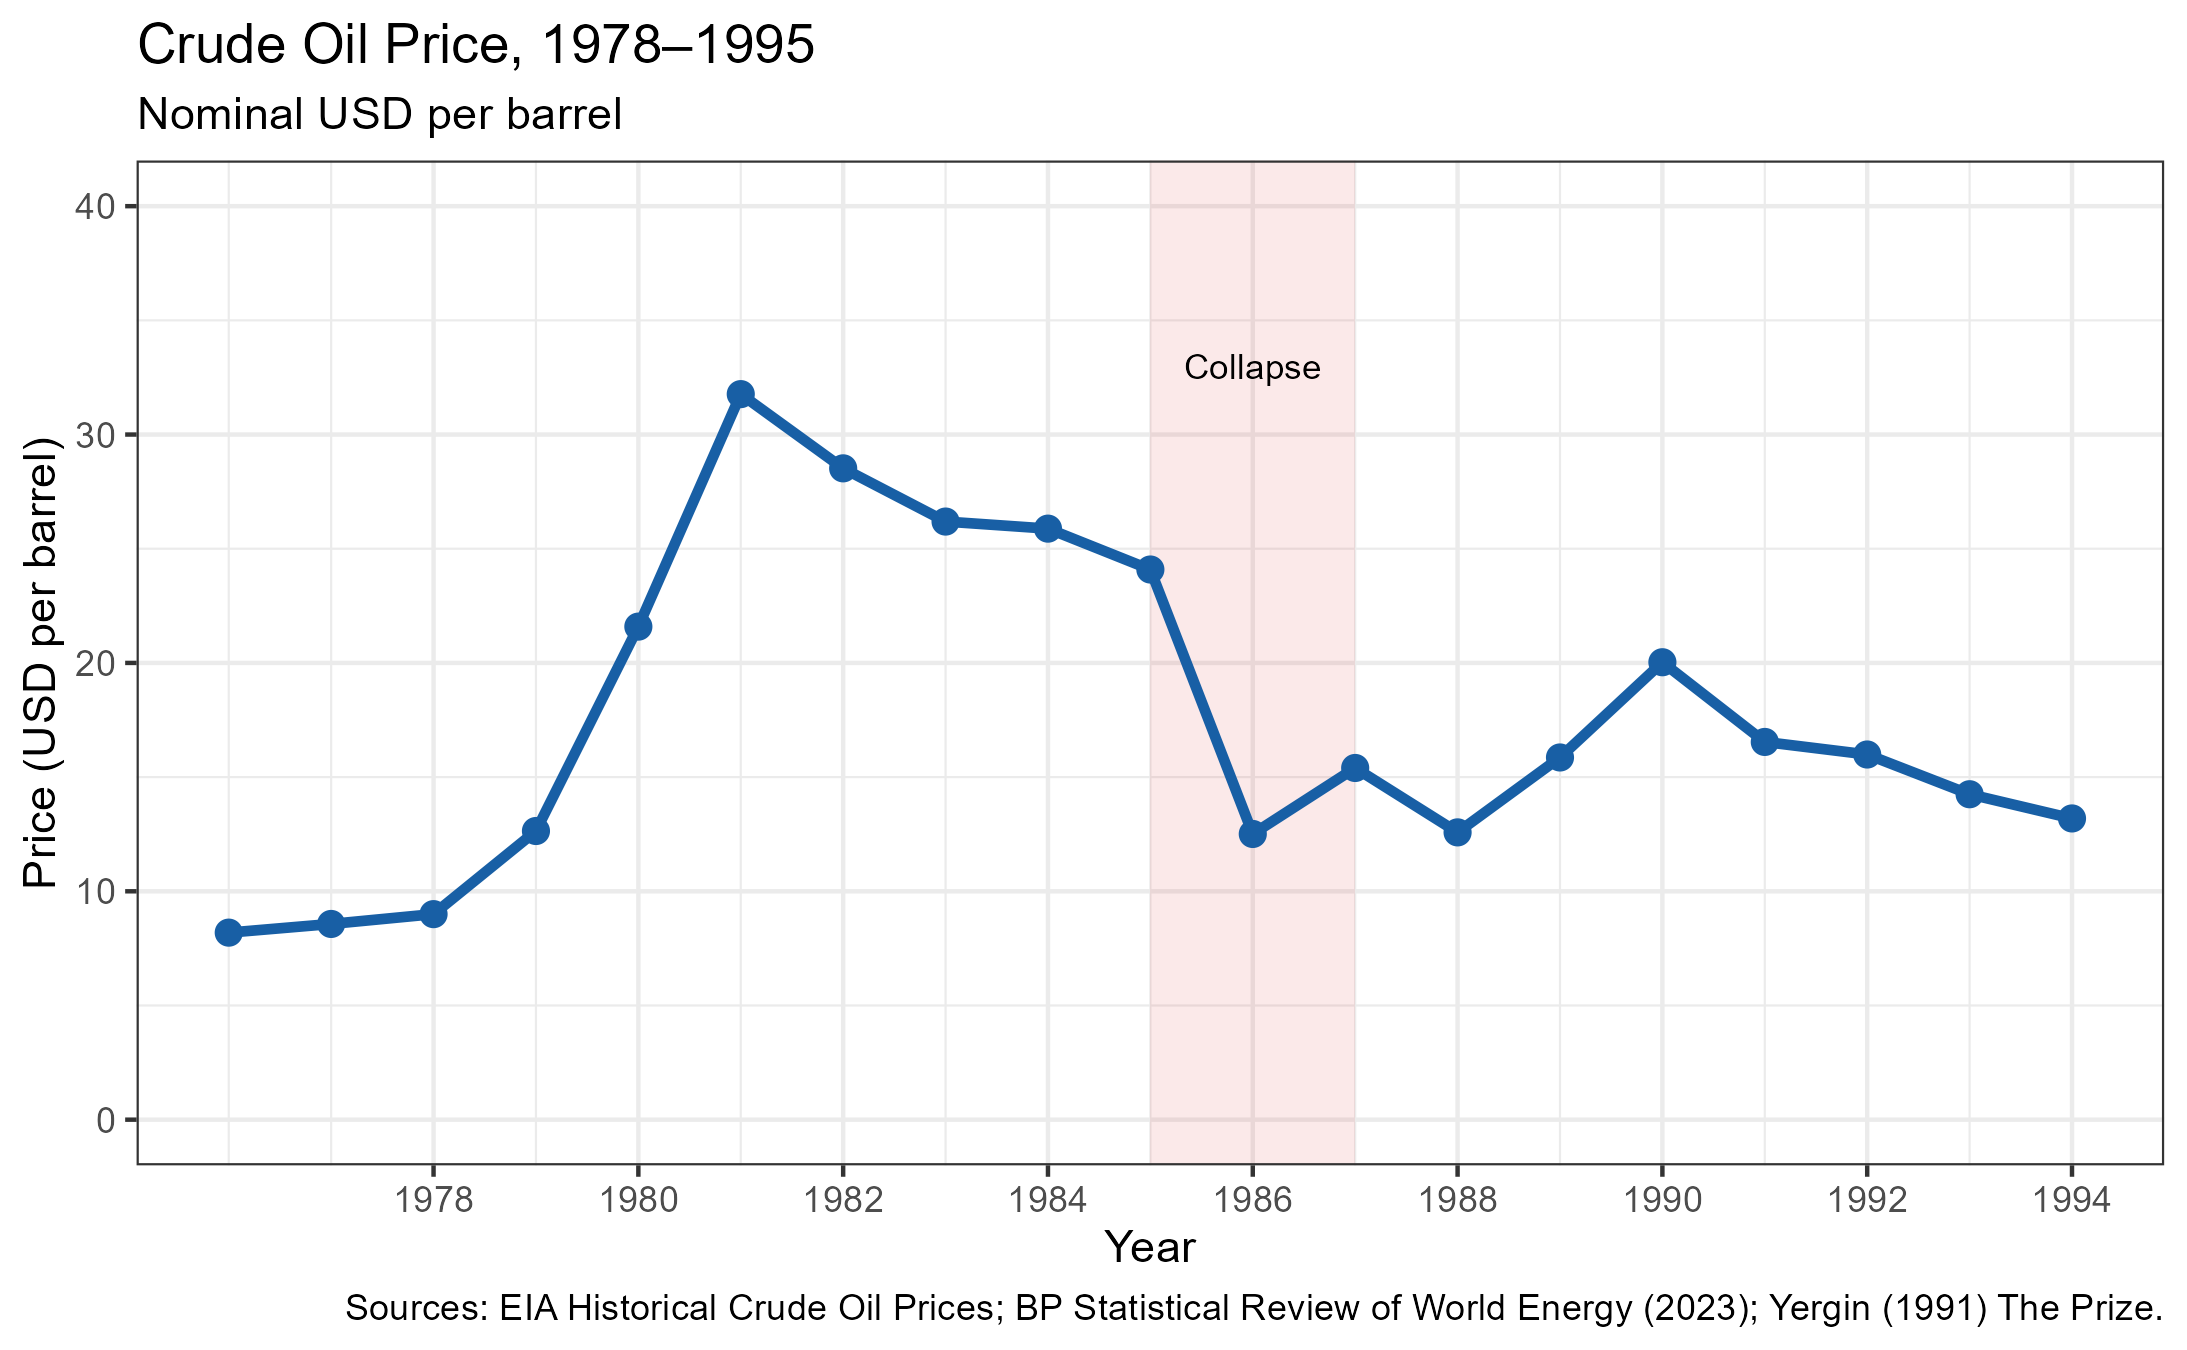
The crisis was primarily between 1985 and 1986, when the price of oil collapsed because Saudi Arabia flooded the global market. Supply drastically increased causing global oil prices to decrease to nearly $10/barrel. Throughout the early 1980s high oil prices made Saudi Arabia extremely wealthy, and allowed them to fund massive government spending projects. During this same time, there was a global recession that lowered oil demand, combined with the fact that non-OPEC member areas such as Alaska started to increase their production. This caused OPEC to encourage Saudi Arabia to cut back on its own output, however, in 1985 Saudi Arabia decided this strategy was no longer viable and decided to increase their production again.
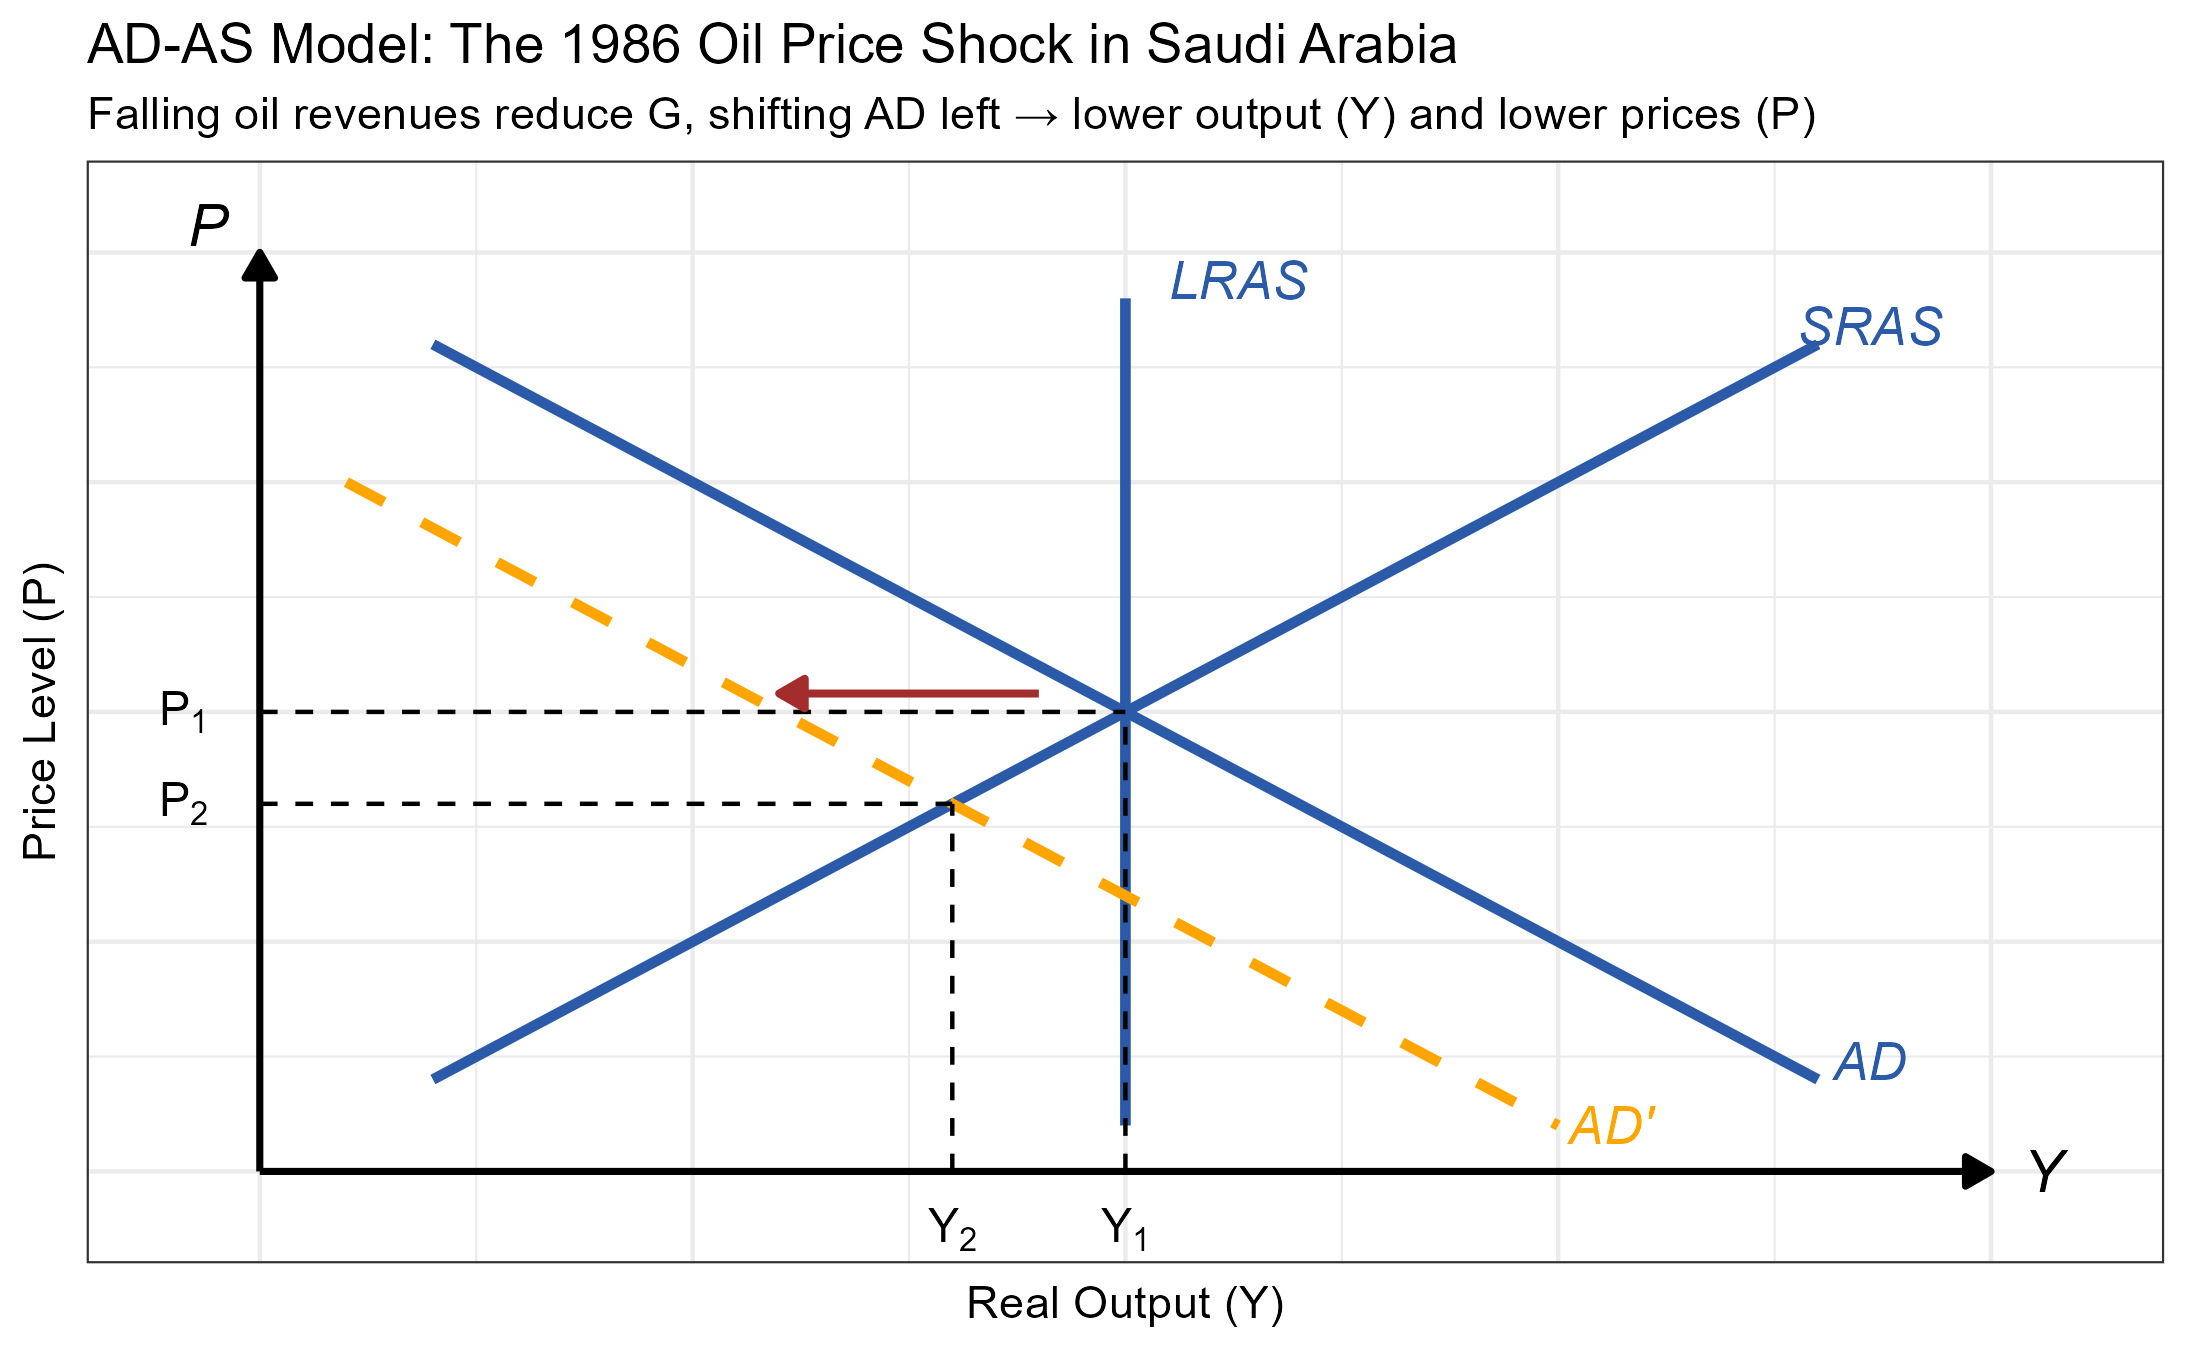
Saudi Arabia’s GDP declined sharply—by roughly 20-30%—between 1981 and 1987. Since oil revenues accounted for nearly half of GDP, the price collapse had a direct negative impact on GDP. The inflation during this period was significantly lower, and actually turned deflationary. This makes sense under our AD-AS framework as an AD shift to the left decreases both output and prices. Unemployment was relatively contained due to the large population of migrant workers. The exchange rate was tied to the US dollar so there was no exchange rate adjustment. Saudi Arabia had built up foreign reserves during the 1970s, but the collapse flipped the financial situation, causing them to have deficits and begin significantly cutting expenditure. The shock affected the economy fiscally in the following way: lower oil revenues led to a government budget deficit, which then led to large cuts in public spending, leading to sectors dependent on government contracts experiencing losses, which caused falling private incomes and consumption.
The government cut spending significantly, especially on major infrastructure projects. OPEC also negotiated a new production agreement that slightly stabilized prices. No monetary policy was used. In the aftermath, the Saudi Arabian economy slowly recovered as prices stabilized. However, Saudi Arabia began to build its sovereign wealth fund to protect against future shocks. GDP per capita did not return to pre-shock levels for many years, and the crisis increased awareness that such a heavy dependence on oil was a structural vulnerability with the economy.


ECONOMIC GROWTH OF SAUDI ARABIA
Saudi Arabia’s long-run economic growth is unique because it is tied almost directly to the price and stability of oil. There are four main eras: The pre-oil boom era, the oil boom era, the oil bust era, and the current vision 2030 era. In the pre-oil boom era, Saudi Arabia was one of the poorest countries in the world, and had an economy based on agriculture and extracting money from pilgrimages to Mecca and Medina. During the oil boom, which was from 1970-1981, Saudi Arabia experienced the most growth in its history. After the 1973 oil embargo that increased global oil prices, Saudi Arabia’s GDP per capita increased substantially, at rates of over 10% per year. The government used these revenues to invest in infrastructure, building new cities from scratch. The 1986 oil price collapse devastated the economy, lowering GDP and prices. Additionally, the gulf war in 1990 generated uncertainty in the region. This era exposed the structural vulnerability of depending too heavily on oil. The fourth and current era has been marked by efforts for diversification. Oil prices have risen at points in the modern era, but price crashes have exposed the same vulnerability, leading the Crown Prince to create a Vision 2030 project to diversify the economy from oil dependence.
Capital accumulation from oil revenues is the primary source of Saudi economic growth. During oil booms, the government heavily invests in infrastructure projects, projects that themselves further foster economic growth. Saudi Arabia’s population grew rapidly, which has driven growth, however, they have a large percentage of migrant workers especially in the private sector. Outside of the oil sector, technological growth has not contributed to a large share of economic growth. The oil sector is very capital intensive and doesn’t employ too many workers, meaning its benefits only drive monetary growth in the economy, not necessarily in employment. More recent reforms to diversify away from oil dependence have driven investment and growth in other sectors of the economy.
Saudi Arabia’s economic growth history highlights the long-term risk of relying too heavily on resources. During oil booms, genuine improvements to infrastructure and quality of life occurred, however, this was a double-edged sword as institutional dependencies were formed. The various crashes over the years and the ensuing negative economic effects made it clear that Saudi Arabia needed to shift towards diversification to reduce their reliance on oil.


Sources and Works Cited
Worldometer. 2024. “GDP by Country.” Worldometer. 2024.
https://www.worldometers.info/gdp/gdp-by-country/
Focus Economics. 2024. “Saudi Arabia Archives.” FocusEconomics. 2024.
https://www.focus-economics.com/countries/saudi-arabia/
Alsharari, Adhullah. (2023). Inflation in Saudi Arabia. ESIC Market. 54. e299. 10.7200/esicm.54.299.
https://www.researchgate.net/publication/372964040_Inflation_in_Saudi_Arabia
Gibs.(2024).Oil and the energy crisis of the 1970s. A reanalysis. Institute for new economic thinking.’
https://www.ineteconomics.org/perspectives/blog/oil-and-the-energy-crisis-of-the-1970s-a-reanalysis#:~:text=The%20main%20triggering%20event%20was,Israel%20during%20the%20October%20war.
International Monetary Fund. Middle East and Central Asia Dept. (2018 ).Saudi Arabia: Selected Issues.
https://www.elibrary.imf.org/view/journals/002/2018/264/article-A002-en.xml#:~:text=Recent%20Labor%20Market%20Policies,also%20introduced%20in%20July%202017.
Saudi Gazette. 2025. “Overall Unemployment Rate in Saudi Arabia Drops to 3.4% in Q3 2025.” Saudi Gazette. December 29, 2025. https://saudigazette.com.sa/article/657769/SAUDI-ARABIA/Overall-unemployment-rate-in-Saudi-Arabia-drops-to-34-in-Q3-2025.
Renad Al Alshaykh. 2025. “Transformations in the Labor Market – NDF.” NDF. September 18, 2025.
https://ndf.gov.sa/en/labor-market/?.
Vanderbilt, Donovan. “VAT in Saudi Arabia 2026: 15% Rate, Rules & Exemptions Guide.” SAUDI VISION 2030 Intelligence Platform, The Vanderbilt Portfolio, 22 Feb. 2026, vision2030.ai/encyclopedia/vat-saudi-arabia/. Accessed 15 Apr. 2026.
https://vision2030.ai/encyclopedia/vat-saudi-arabia/
(2023). Statistical review of world energy.
https://www.bp.com/en/global/corporate/energy-economics/statistical-review-of-world-energy.html
Bui, H. (n.d.). Note on AD-AS model [Course notes]. ECN 282 Macroeconomic Analysis, Grinnell College.
Gately, D. (1984). A ten-year retrospective: OPEC and the world oil market. Journal of Economic Literature, 22(3), 1100–1114.
https://www.jstor.org/stable/2724859
International Monetary Fund. (2023). World economic outlook database [Data set].
https://www.imf.org/en/Publications/WEO/weo-database/2023/October
International Monetary Fund. (various years). Article IV consultation — Saudi Arabia.
https://www.imf.org/en/countries/SAU
Kapiszewski, A. (2001). Nationals and expatriates: Population and labour dilemmas of the Gulf states. Ithaca Press.
Looney, R. (1990). Saudi Arabia’s development potential. Lexington Books.
Saudi Arabian Monetary Authority. (various years). Annual report.
https://www.sama.gov.sa/en-US/EconomicReports/Pages/AnnualReport.aspx
World Bank. (n.d.). Saudi Arabia [Data set]. World Bank Open Data.
https://data.worldbank.org/country/saudi-arabia
Links to External Images used:
https://otbttravel.au/explore-saudi-arabia-off-the-beaten-track-travel/