Policy Analysis Using Macroeconomic Models
Expansionary Fiscal Policy
Increase in Government Spending
In January 2009, Norway implemented an expansionary fiscal policy in response to the global downturn caused by the 2008 Financial Crisis. The government increased public spending as part of a stimulus package aimed at supporting economic activity and stabilizing the economy.
This policy was introduced during a period of significant economic uncertainty and declining global demand.
As a small open economy with strong ties to international markets, Norway was vulnerable to these external shocks.
From a macroeconomic perspective, this policy, Increase in government spending (G) primarily affects aggregate demand (AD).
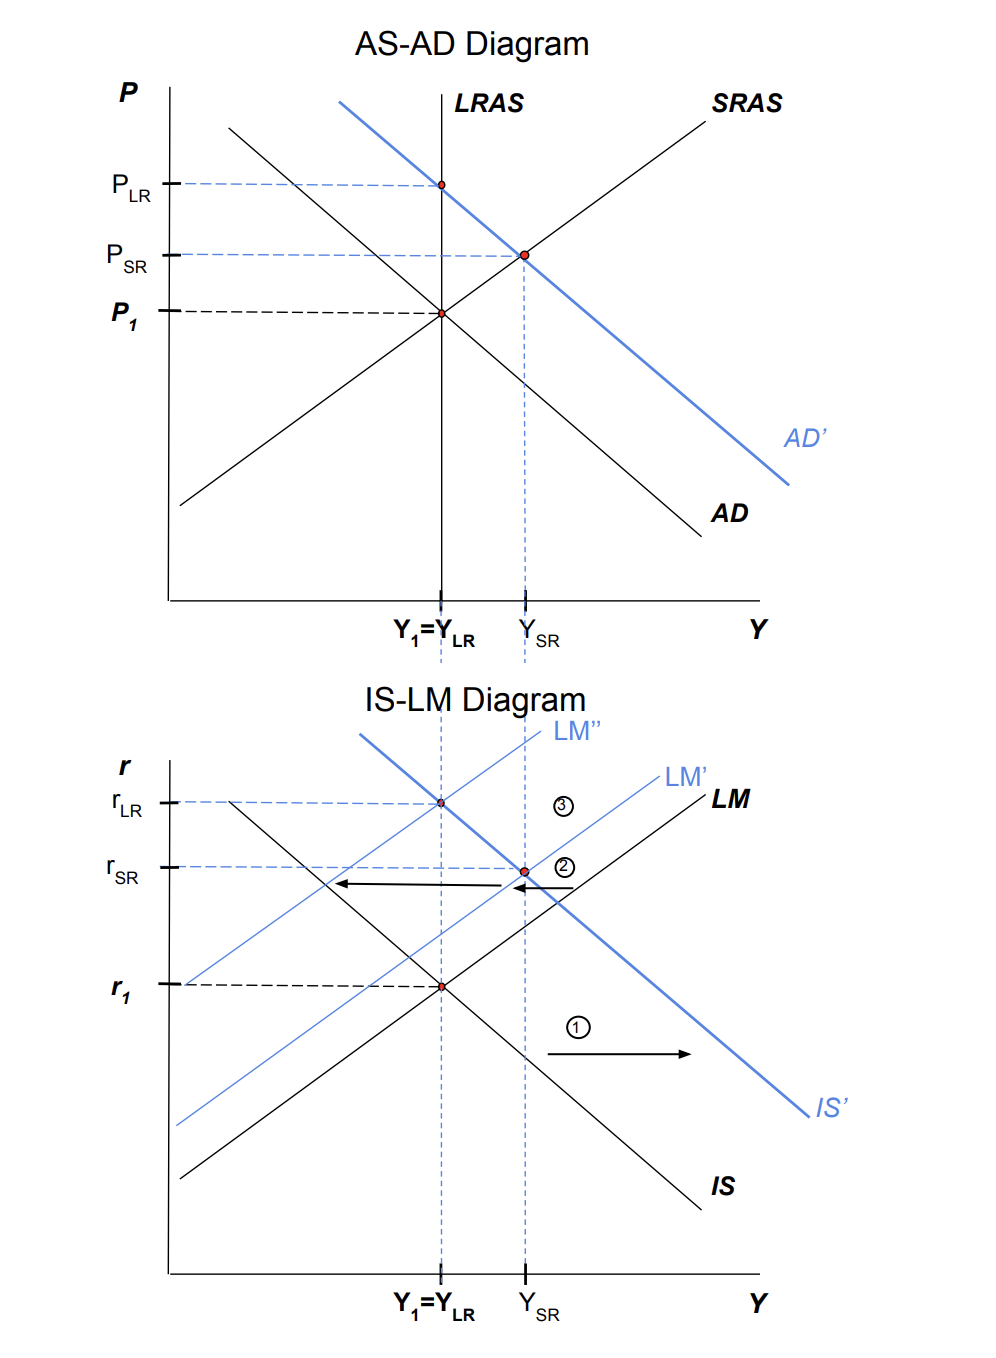
The expected effects of the policy
- Increase in price and interest rates.
- Temporary increase in output.
- Decrease in investment.
- Ambiguous outcome in Short term and a Decrease in long run consumption
- Temporary increase in labor.
- Temporary decrease in real wages.
AS-AD Diagram
An increase in government spending affects aggregate demand by shifting the AD curve outward. It will lead to a higher price in both the short run and the long run, and higher output for the short run, and going back to the original point in the long run.
IS-LM Diagram
IS curve shifts outward which is caused by an increase in G and then shifts the LM curve inward by higher P in the short run. In the long run, it shifts the LM curve further inward by even higher P.
Labor Market Diagram
In the labor market, the real wage in the short run goes down, and labor goes up due to an increase in P. However, in the long run, the real wage and labor go back to the original points because the expected price is adjusted to the change in P.
How successful was the model?
Short Run – From January 2009 to December, the price index went up slightly from 64.4 to 65.9 in the following year, December 2010, prices went up to 67.7. Though this change was minimal, it is consistent with the predictions of the AD–AS model. Even though this change is consistent with the model, it would be wrong to attribute it only to the expansionary policy since the modest change can also be caused by Norway’s natural rate of inflation.
Long run – If we classify the long run as a decade and compare annual averages, the 2019 price index of 80.4 is higher than that of 2009, 65.3. This is consistent with the AD-AS model predictions; we see that the long-run price effect is larger than the short-run one.
https://www.ssb.no/en/priser-og-prisindekser/konsumpriser/statistikk/konsumprisindeksen
According to FRED data, The Real GDP for Norway increased in both the short term and the long term.
Short term – According to FRED data, real GDP for Norway initially decreased from 661,388 million euros in Q1 2009 to 657,171 million euros in Q2 2009. However, by Q1 2010, GDP had increased to 671,595 million euros. This pattern is consistent with the short-run predictions of the AD–AS model, where an expansionary policy leads to a recovery in output following an initial downturn.
In the long run, real GDP continues to increase, reaching 799,161 million euros in 2019. While the AD–AS model predicts that output returns to its natural level, this does not imply that GDP must fall back to its previous level. Instead, the natural level of output can grow over time due to factors such as technological progress and capital accumulation. Therefore, the continued increase in real GDP is not inconsistent with the model.
In reality, interest rates decrease both in the short and long run. That is not fully consistent with the IS-LM model’s prediction.Interest rates were also affected by expansionary monetary policy and cutting interest rates by the Norges bank.
https://ycharts.com/indicators/norway_real_interest_rate
https://data.worldbank.org/indicator/FR.INR.RINR?end=2024&locations=NO&start=2013&view=chart
According to the model, in the short run, the effect on consumption is ambiguous. Ambiguity is caused by a predicted increase in output and an increase in interest rate. In reality, we saw consumption increase as interest rates decreased and output increased. We saw an increase in both the short run and long run, which is inconsistent with the model.
https://data.worldbank.org/indicator/NE.CON.TOTL.KN?end=2019&locations=NO&start=2009
The investment can be measured by gross fixed capital formation as a percentage of GDP. In the short run, it decreased from 23% in 2009 to 21% in 2010. In the long run, it consistently increased to 27%, rather than decreasing further. Possible reasons can be the trend of increasing investment for clean energy infrastructure, partially supported by the government spending itself.
https://data.worldbank.org/indicator/NE.GDI.FTOT.ZS?end=2010&locations=NO&start=2008
Labor can be measured by total employment. In the short run, employment (15 years old or over) increased from 2,509,894 persons in 2009 to 2,514,409 persons in 2010. In the long run, it increased further and consistently to 2,728,536 persons in 2019. It does not exactly align with the prediction we made from the model, as it was supposed to go up and then back to the original point. The possible reasons can be the recovery from the 2008 financial crisis that encouraged firms to hire more workers; the government spending that supported public sector employment; and Norway’s stable labor market institutions and growth in sectors, such as construction and services, that contributed to sustained employment growth in the long run.
Although the real wage increased 1.5% in 2010 from the previous year, it is a weak increase compared to the years before and after the financial crisis. In the long run, the real wage increased by about 12% between 2009 and 2020, but the growth was modest and uneven. The deceleration of the real wage growth partially aligns with the model’s prediction of a decrease in the short run. In the long run, economic recovery and productivity growth pushed the real wage upward, but it fluctuated with different factors, such as the oil price shock in 2014.
https://www.ssb.no/149409/annual-earnings.nominal-and-real-values.average-for-all-employees
Discrepancies and Interpretation
The AD-AS, IS-LM, and labor market models provided a useful framework and were able to predict some changes following the expansionary fiscal policy of Norway in 2009.
The models correctly predicted Price changes and Short-run output increase.
The model had multiple discrepancies.
In the long run, real GDP continues to increase, reaching 799,161 million euros in 2019. While the AD–AS model predicts that output returns to its natural level, this does not imply that GDP must fall back to its previous level. Instead, the natural level of output can grow over time due to factors such as technological progress and capital accumulation. Therefore, the continued increase in real GDP is not fully inconsistent with the model.
It is important to note that Inconsistency in terms of interest rates was caused by Norges Bank cutting interest rates and having a strong expansionary monetary policy. Increase in consumption, both long and short term, can be explained by the decrease in interest rates.
There are also several discrepancies in the changes in investment, labor, and real wages in reality. Those outcomes different from the model predictions come from a variety of reasons, such as the effect of the financial crisis itself rather than the fiscal policy implemented after; some real-world-specific trends in investment, including an increase in investment for renewable energy; and a more long-run trend in an increase in the real wage due to economic recovery and productivity growth.
Our Conclusion
While the observed outcomes were not fully consistent with the model’s predictions, it is important to note that the analysis of the effect of increased government spending was conducted. In reality, the economy was already affected by the 2008 financial crisis, and additional policies such as expansionary monetary policy were implemented simultaneously. These factors influenced the observed outcomes. This highlights the limitations of the AD-AS framework in capturing real-world complex economic dynamics, particularly simultaneous policy changes and external shocks.
Contractionary Monetary Policy
Decrease in Money Supply
In 2022, Norges Bank implemented a contractionary monetary policy by raising interest rates multiple times throughout the year. The policy involved increasing the policy rate from near zero to around 2.75% in order to slow down economic activity. This policy was introduced in a context of rising inflation, driven by strong post-pandemic demand and higher global energy prices. Inflation in Norway had moved above the central bank’s target, creating concern about sustained price increases and overheating in the economy. This policy primarily affects aggregate demand, as higher interest rates reduce consumption and investment by making borrowing more expensive, which in turn lowers overall demand in the economy.
From a macroeconomic perspective, this decrease in money supply (M) shifts the aggregate demand (AD) curve in.
AD-AS Model
IS-LM Model
Labor Market Model
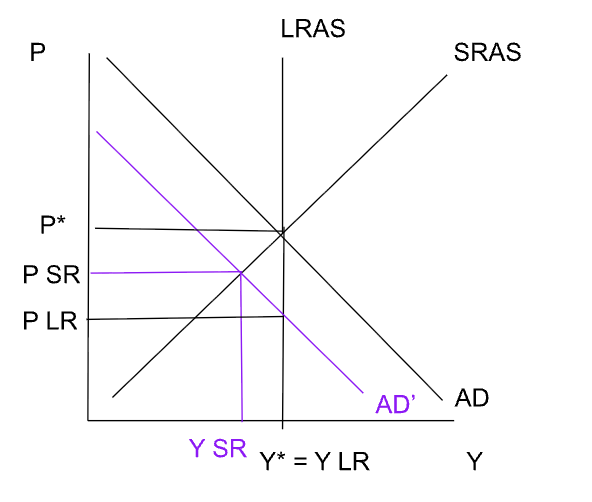
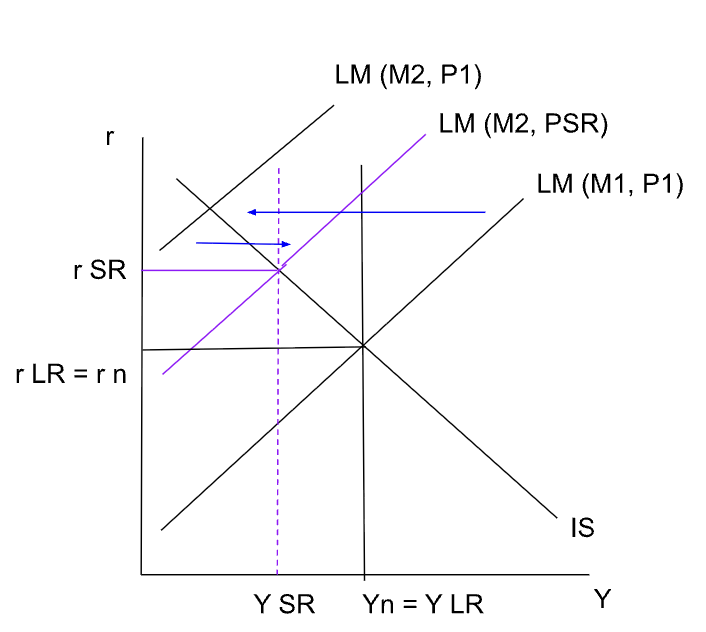
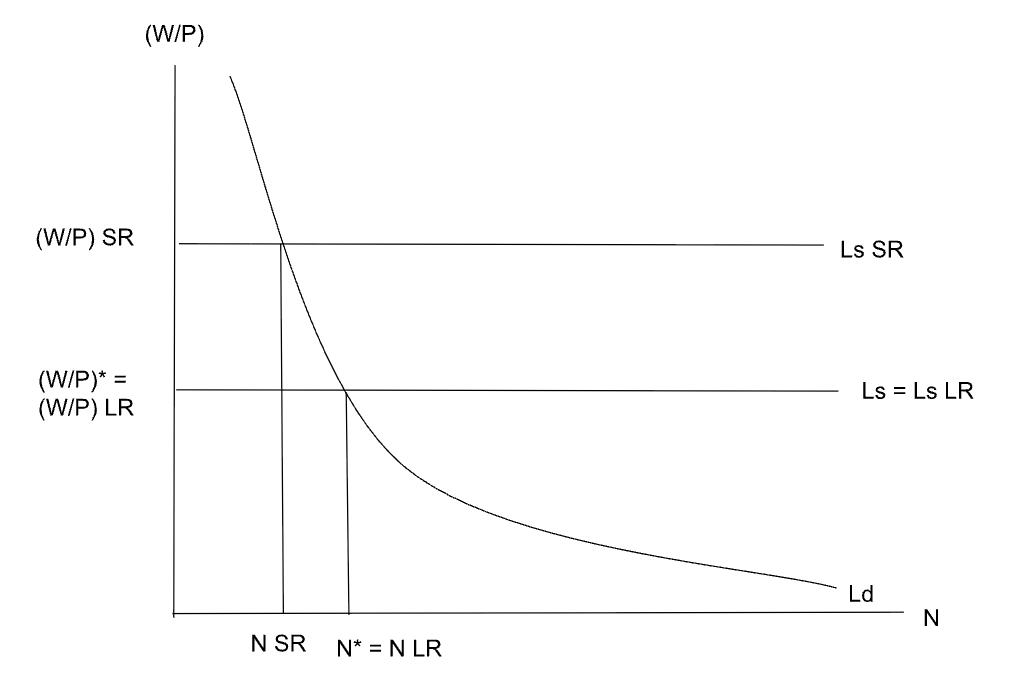
Using the AD-AS, IS-LM, and labor market models, the contractionary monetary policy implemented by Norges Bank in 2022 leads to a slowdown in economic activity. In the AD-AS model, higher interest rates reduce consumption and investment, causing aggregate demand to shift left (AD -> AD’). This results in a decrease in both output (from Yn to Y SR) and the price level (from Pn to P SR), creating a short-run recessionary gap. In the IS-LM model, the increase in interest rates is represented by a leftward (upward) shift of the LM curve. This leads to a higher equilibrium interest rate and lower output, reinforcing the decline in economic activity seen in the AD-AS model. In the labor market, the fall in the price level increases the real wage, which in this framework leads to an increase in labor supply (Ls shifts right). This reflects workers responding to higher real wages, although overall economic activity is still contracting. Overall, across all three models, the policy reduces output and slows the economy in the short run, which helps bring down inflation but comes at the cost of lower production and weaker labor market conditions.
How successful was the model?
Short Run:
In the short run following the 2022 contractionary monetary policy, inflation in Norway remained relatively high initially before beginning to slow. This reflects short-run price stickiness, where the price level does not immediately fall even though aggregate demand shifts left. While the AD-AD model predicts a decrease in the price level, in reality the adjustment is more gradual, with inflation slowing before prices fully respond.
Long Run:
In the long run, inflation declines more noticeably as the effects of higher interest rates reduce demand in the economy. This is consistent with the AD-AS model, where a sustained leftward shift in aggregate demand leads to a lower price pressure and a stabilization of the price level over time.
Short Run:
In the short run, output growth weakened as higher interest rates reduced consumption and investment. This aligns with the AD-AS model, where contractionary monetary policy leads to a decrease in output due to lower aggregate demand.
Long Run:
In the long run, output returns toward its natural level as the economy adjusts. While growth may remain positive, it stabilizes at a more sustainable level. This is consistent with the AD-AS framework, where output converges back to Yn even after a short-run decline.
Short Run:
In the short run, interest rates in Norway increased following the 2022 contractionary monetary policy. In the IS-LM model, this is represented by a leftward shift of the LM curve, which raises the equilibrium interest rate and lowers output. This is consistent with the data, as tighter monetary conditions lead to higher borrowing costs and reduced economic activity.
Long Run:
In the long run, as the price level decreases, real money balances increase, which causes the LM curve to shift back to the right. This puts downward pressure on interest rates, allowing them to stabilize or decrease from their short-run peak. This adjustment is consistent with the IS-LM framework, where changes in the price level help restore equilibrium over time.
Short Run: In the short run, the model would predict that consumption would decrease because output decreases and the interest rate increases. In 2021, before the contractionary monetary policy was introduced, the final consumption expenditure was 2.52 trillion. When the interest rate was being raised in 2022, the final consumption expenditure was 2.66 trillion. In 2023, the final consumption expenditure was 2.67 trillion. In 2024, the final consumption expenditure was 2.72 trillion.
Long Run: In the long run, the model would predict that consumption would stay the same because the output and the interest rate stay the same.
Short Run: In the model, investment was expected to decrease because the interest rate increased in the short run in the IS-LM model. Investment was measured through the producer price index for investment goods domestically. In quarter 1 of 2022, the producer price index was 120.41. In quarter 2 of 2022, when the interest rate was raised, the producer price index was 125.11. In quarter 3 of 2022, when the interest rate was raised again, the producer price index was 127.38. In quarter 4 of 2022, the producer price index was 128.81.
Investment increased in 2022 which follows how the model predicted investment would increase in the short run. Investment likely increased due to increased oil and gas spending and growth of the Norwegian sovereign wealth fund. Foreign direct investment also remained stable and the country increased its investment security screenings.
Long Run: In the model, investment in the long run would remain the same because the interest rate would remain the same.
Short Run: The labor market model predicted an increase in the labor supply which would decrease employment in the short run. The employment can be measured using the total employment and the employment ratio. The employment to population ratio for those 15 years or older as a total percent of the population in Norway was 63 in 2021. This increased to 64 in 2022 after the contractionary monetary policy changes. It remained at 64 in 2023, then decreased to 63 in 2024 and 2025. This shows how the employment briefly increased after the interest rate change but ultimately remained the same. The total number of employees increased from 2021 to 2024. In 2021, 2,644,250,25 people were employed which increased each year until it reached 2,745,324.75 people employed in 2024. This shows how the total employment increased in the short run. The labor market shows some rising employment, but it has been low enough that some metrics would consider the employment to be stable. Neither of these would agree with the estimates of the labor market model.
Long Run: In the model, the labor market in the long run would remain the same because the price expectations would equal the actual prices.
Short Run: In the short run, real wages are expected to increase due to the increase in labor supply predicted by the model. The actual real wage growth has been minimal from 2015-2023 according to Statistics Norway. The year 2024 was expected to have the first real wage growth with forecasts estimating around 1.9%.
Long Run: The model predicts real wages will remain the same in the long run because the price expectations will be equal to the actual prices and the labor market will adjust.
Discrepancies and Interpretation
The consumption in the short run was expected to decrease, however, the final consumption expenditure from 2022 to 2024 actually increased. The measurement of the final consumption expenditure is in NOK adjusted for inflation. There was about a 10 billion NOK increase in 2023 and a 50 billion NOK increase in 2024. The contractionary monetary policy did not start until March 2022 where Norges bank increased the interest rate from 0% to 0.75%. In June, the interest rate was increased again to 1.25% and then again in December to 2.75%. This slower introduction of the change in the interest rate could mean the impacts did not have a high enough magnitude to impact the consumption more than other impacts. These other impacts could include the impacts of Covid on different industries, supply-chain impacts, and the housing and car markets. There were also electricity subsidies in 2023 which could have accounted for households having more money to spend. It is also possible that consumer sentiment was playing a role in the consumption outcome. In 2022, there were multiple reasons consumer sentiment could have changed. The Russian invasion of Ukraine and increased defense spending by Norway could have lowered consumer sentiment which would not be in line with these outcomes. The post-pandemic economic changes along with the reopening of many industries could have increased consumer sentiment. Since consumer sentiment is hard to determine, it is possible this is the reason for the increase in consumption. Another factor to acknowledge is that prior to the Covid pandemic in 2020, the final consumption expenditure has trended upward since measurement started in 1970.
The Norges Bank believes that employment has continued to rise and there have been greater shortages of labor. The Norges Bank also notes that the increased employment has been “particularly strong in the industries most affected by pandemic-related conditions”. The report from the Norges Bank also mentions how the employment rate is at its highest level in more than ten years. This information from the Norges Bank could mean there are further indicators in the labor market that are suggesting a better market, beyond the employment ratio and total employment. The model predicts a higher labor supply which can be seen with lower unemployment rates and higher number of employed people. It is also possible, however, that the labor demand may have increased as well due to post-pandemic conditions not fully accounted for by the model. The Norges Bank claims it is a tight labor market which means that the demand for workers exceeds the supply of workers. This could mean that the model we predicted is inaccurate because the real Norwegian economy has not yet reached this equilibrium, but given how the data has remained stable for a few years, it is likely the labor demand. If the labor demand increased after the Covid pandemic, the labor demand curve would shift out which would lead to a higher employment and the results that are being seen. Adapting our model to account for this labor demand, with further evidence of its existence in Norway, could help our model become more accurate to real-world circumstances.