Introduction
Denmark is situated in the Nordic region, drawing strong ties to its neighboring countries in the economy. With a current GDP of $500 billion, Denmark is an advanced, high-income nation known for their advancements in software, business and financial sectors, pharmaceuticals, and renewable energy. Denmark saw tremendous growth in the 1960s during the expansion of the industrial and business sectors, which have continued to fuel the economy. Due to their continued growth, Denmark is one of the wealthiest nations globally, having a GDP per capita of approximately $71,026 USD. Despite for their strong economy, Denmark is currently facing a fluctuating real GDP value of around 2% due to the weakening of the pharmaceutical sector.
Coming out of the 2020 pandemic, Denmark maintained their economy, experiencing tremendous export growth and a stable inflation rate. Other than a 2022 spike in inflation due to energy crises and supply chain issues, they have held a moderately low rate of 1.37% in 2025. While there has been growth in particular sectors, Denmark is also facing uncertainty with its future, seen through the rise in interest rates and low confidence in households.
Denmark has been receptive to U.S. investments, primarily focusing on the growth in technology and healthcare markets. Increases in U.S. shares in these sectors are expected in the coming years due to the advancements taking place.
Macroeconomic Indicators
Policy Analysis
COVID-19 Policy Response
At the beginning of the COVID-19 pandemic, Denmark responded to the challenges presented with a substantial increase in government spending in hopes to protect the economy from recession. In order to avoid layoffs and bankruptcies in March of 2020, the Danish government introduced a series of relief packages worth a total of DKK 285 billion (US $42 billion) to provide to businesses and workers until June.
The government decided to support 90% of the monthly wages for hourly workers making up to DKK 26,000 (US $3,800), along with 75% of wages for salary workers covered up to DKK 23,000 ($3,350). In addition to workers, small businesses losing 40% of revenue received up to 80% of regular expenses by the government. For companies closing, they will be covered with 100% of expenses. Continuing these programs through June, workers and businesses were subsidized in the short term, hoping to limit the issues presented by the pandemic. With these increases in government spending, Denmark’s aggregate demand increased during this time, providing businesses and workers with sustainable forms of income.
Following the subsidies presented to businesses and workers, the Danish government saw a sudden decline in GDP due to the effects of COVID, but recovered in the second half of 2020 and into 2021, seen through the annual GDP growth rising to 6.5% in 2021. Denmark’s unemployment rate saw limited effects during COVID, reaching a high of 5.6% in 2020, then returning back to its prior levels of 5.1% in 2021 and 4.4% in 2022. By preserving hundreds of thousands of jobs, the shocks to the economy were modest, enabling the recovery to be less severe. In addition, the inflation rate remained low in 2020 at just 0.4% and saw a slight increase to 1.9% in 2021. As these provisions allowed companies and citizens to continue to spend in the economy, Denmark endured a period much less significant compared to their neighboring countries.
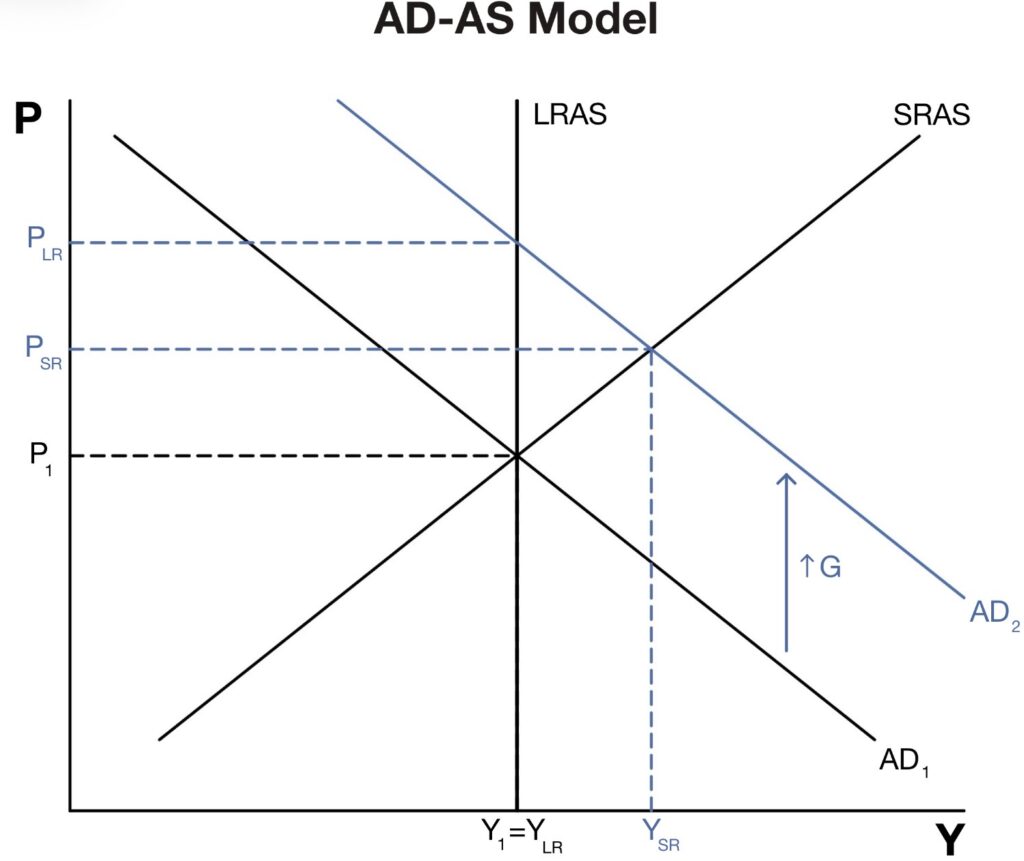
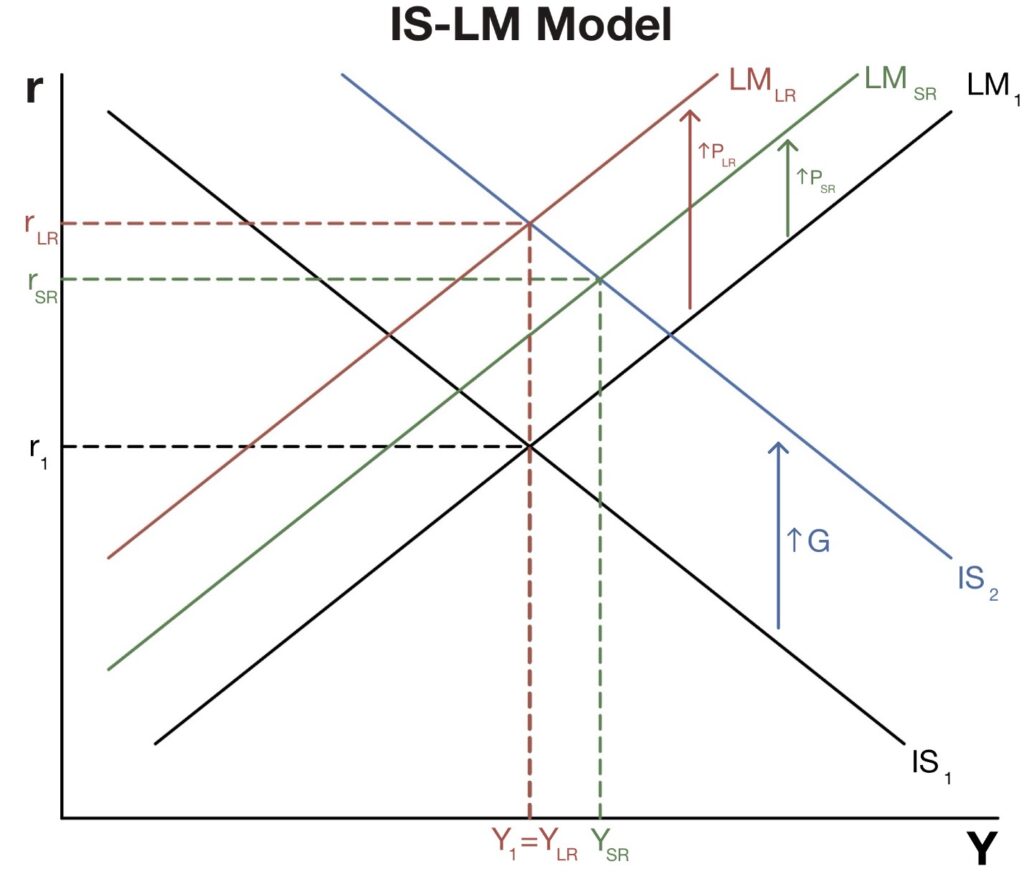
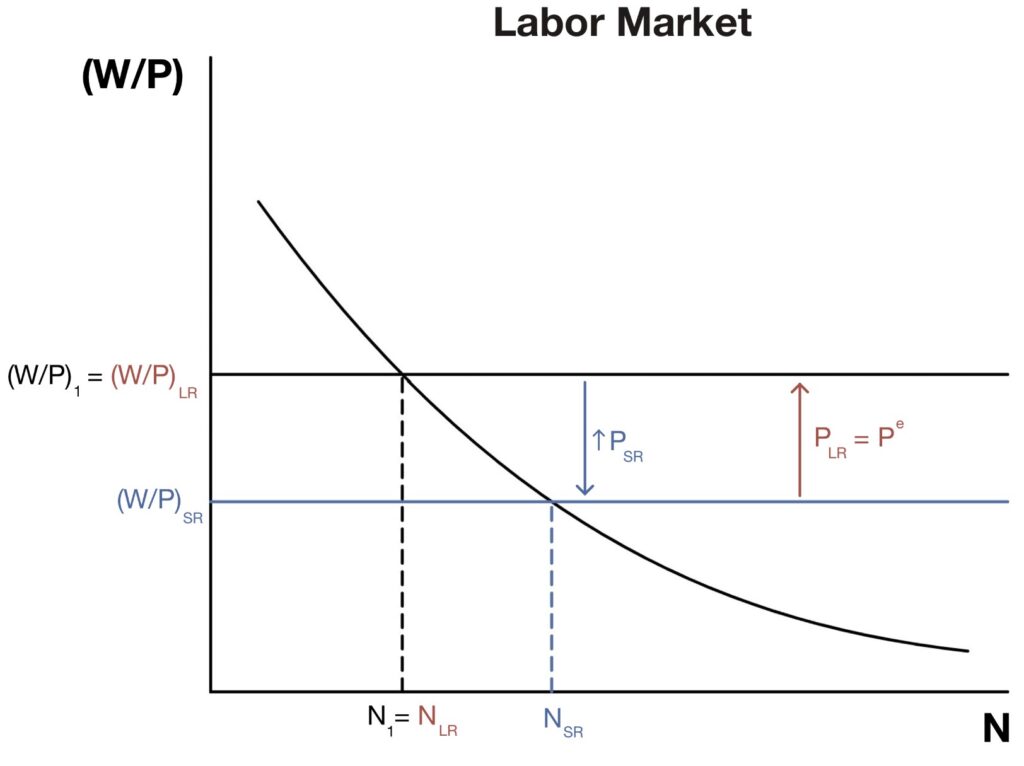
AD-AS, IS-LM, and labor market diagrams modeling their predictions when there is an increase in government spending.
When analyzing these shifts in the economy with the predictions of the AD-AS model, the effects of the Danish government are consistent with the model. Due to the increase in aggregate demand, the shift outward forces prices to increase in the short run and long run, seen through the slight increase in inflation rate during this period. Based on the labor market predictions, an increase in the current price level of goods and services will shift the real wage rate down in the short run, which occurred for workers in Denmark. The subsidies provided substantial income to them, but only at a certain percentage of their previous income prior to COVID. For those not working during the beginning of the pandemic, their wages decreased in the short run as they were out of work.
The real-world economic outcome following Denmark’s relief packages are consistent with the predictions of the AD-AS model, seen through the cushioned decline in GDP, the brief increase in unemployment rate, and the slight increase in inflation. One notable discrepancy are the predictable effects of interest rates in the IS-LM model. With an increase in government spending, this expansionary fiscal policy would shift the IS curve out, along with shifting the LM in, increasing output and putting upward pressure on interest rates. This effect did not occur in the Danish economy, seen through the low interest rates continuing through 2022. A reason for this is due to the monetary policies the European Central Bank were conducting to keep the interest rates to a near 0% to support the European economy during this period. Holding the LM curve in position and nearly flat, the pressure placed by the IS curve had no effect on the economy. By incorporating potential adjustments to the LM curve based on the elasticity in the market, the IS-LM model could better predict the outcomes of real-world effects.
1973 Oil Crisis Response
Denmark entered the 1973 oil crisis in an especially vulnerable position. Before the crisis, Danish energy policy was largely laissez-faire: the country relied on imported energy, had no broad national energy strategy, and, aside from a low tax on gasoline, generally allowed cheap imported fuel to flow into the economy with little state intervention. By October 1973, around 90 percent of Denmark’s energy consumption was based on oil, and about 90 percent of that oil came from the Middle East. When OAPEC cut output and oil prices surged, the result for Denmark was slower growth, higher inflation, and rising unemployment.
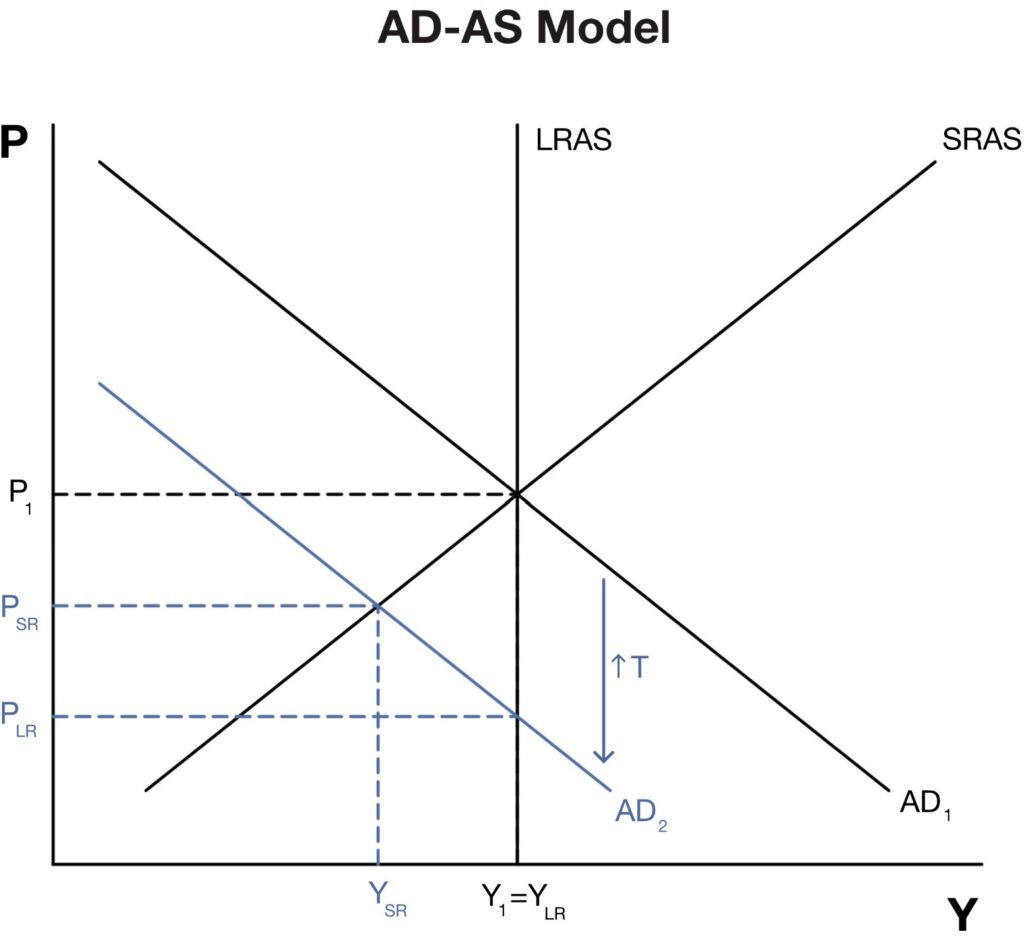
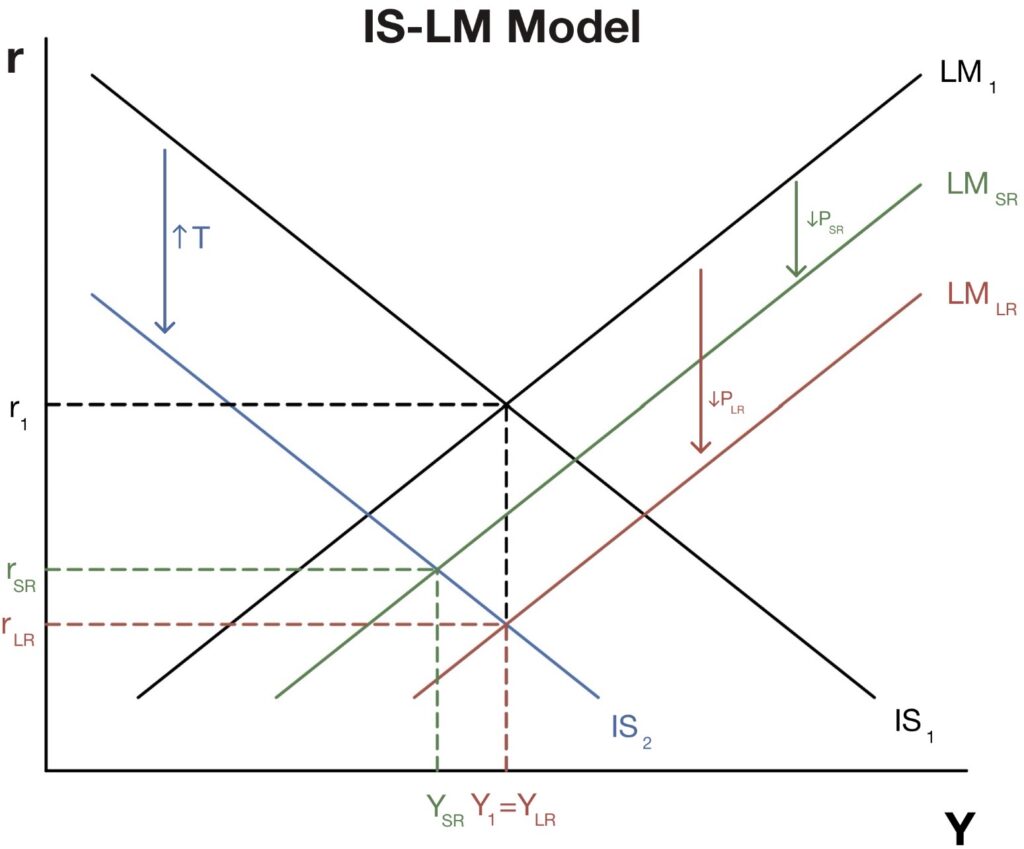
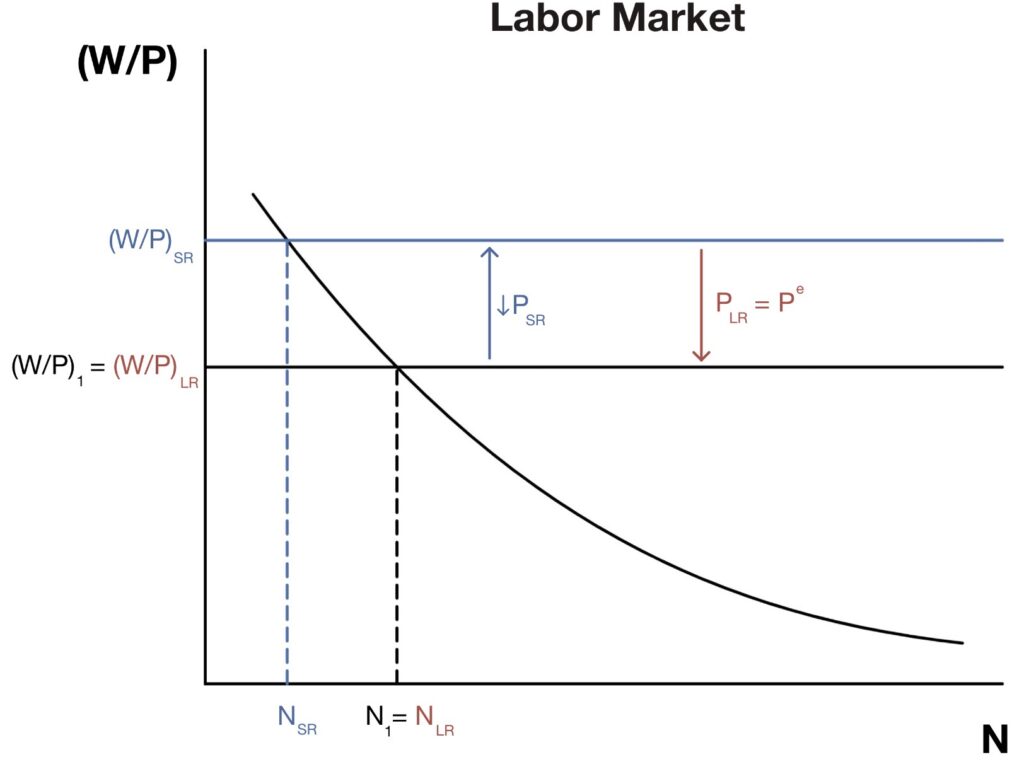
AD-AS, IS-LM, and labor market diagrams modeling their predictions when there is an increase in tax.
The AD-AS graph shows a contractionary shift in aggregate demand from AD₁ to AD₂. Higher taxes on energy use reduce households’ real disposable income and discourage consumption of fuel, heating, transport, and other energy-intensive goods. They also reduce firms’ willingness to invest in energy-heavy production. The price increase itself was already very effective in curbing energy use, and this experience later facilitated future taxes on the production and use of energy. Later Danish policy explicitly used energy taxes to reduce consumption and encourage energy-saving measures.
In the AD-AS graph, that leftward shift in aggregate demand lowers output in the short run from Y₁ = YLR to YSR and lowers the price level from P₁ to PSR. Once taxes and other conservation measures reduced spending, Danish firms faced weaker demand and lowered production. Danish authorities introduced broad measures to change behavior, including conservation campaigns, lower room temperatures, subsidies for insulation, and, over time, taxes and incentives designed to curb energy consumption and make the economy less vulnerable to imported fuel.
The labor-market graphs show the short-run employment effect of this fall in aggregate demand. As the price level falls while nominal wages remain sticky in the short run, the real wage rises from (W/P)₁ = (W/P)LR to (W/P)SR. For firms, labor becomes more expensive in real terms, so they move up along labor demand and reduce employment from N₁ = NLR to NSR. In other words, the tax increase contributes to a recessionary gap: output falls, employment falls, and the economy operates below its long-run level for a time. This is consistent with the broader Danish experience in the 1970s, when policymakers were trying to trade off supply security, inflation pressure, and unemployment in a much more unstable economic environment than before.
Denmark’s policy response was meant to both reduce demand temporarily and restructure the economy’s energy use. After the first oil crisis, Denmark moved to a policy-driven energy system (as opposed to a market-driven system), using regulation, incentives, subsidies, and taxes to reduce dependence on oil, improve efficiency, and diversify toward coal, natural gas, and eventually renewables. Later Danish policy documents likewise emphasize that energy taxes were used to reduce consumption and promote energy-saving behavior, while Denmark’s total energy consumption eventually flattened even as GDP continued to grow.
Extreme Macroeconomic Event - 2008 Financial Crisis
In 2008, Denmark experienced a severe housing and financial crisis, intensified by the global shocks triggered by the collapse of Lehman Brothers Holdings Inc. in September 2008. Prior to this, Denmark was experiencing high and sustainable economic growth, low inflation and low interest rates. Due to these conditions, there were high levels of optimism across all of society, leading to risks being underestimated in the markets.
Beginning in 2003, Denmark legalized interest-only mortgages to improve the housing affordability and financial flexibility for households. With the implementation of these mortgages along with the adjustable-rate mortgages already in place, households were provided with lower initial borrowing costs, allowing them to take more risks in the market. These mortgages raised real housing prices by nearly 85% between 2000 and 2007. Along with the housing bubble, there was a price bubble on the market for commercial real estate, forcing prices to rise about 200% within this period. Households continued to pile debt at extraordinary rates. With the closure of Lehman Brothers, this put mounted pressure on the Danish Krone, forcing Denmark to raise the interest rates on two different occasions in order to defend the fixed exchange rate policy. By 2007, the market began to turn, causing the economy to slow down and force Denmark into their most severe recession since World War II.
Graph of Denmark’s real GDP Growth from 2004-2019, revealing an extreme negative shock during the 2008 financial crisis
Graph of Denmark’s unemployment rate from 2004-2019, revealing an extreme negative shock during the 2008 financial crisis
The financial crisis led to detrimental effects on the economy, seeing real GDP growth fall from 3.8% in 2006 to -5% in 2009. Declining housing prices and increasing debt eroded household wealth, oppressing consumer sentiment and spending. Due to the sharp contractions of various sectors, job loss grew rapidly. Denmark experienced a rise in unemployment that reached 6.1% in 2010 and remained at high levels for many years after. The Danish flexicurity model of high labor market flexibility and income security allowed firms to easily fire employees due to the extreme loss in demand.
The Danish government acted quickly to limit to effects of the recession, mainly through tightening the regulation and supervision of the financial sector. The introduction of the Danish Budget Act put caps on government spending in order to stay within financial limits for the fiscal year. Major automatic stabilizers were set in order to absorb the shock of the recession, seen by the boosted social benefits and reduced tax burdens. Denmark’s actions to combat the recession allowed for a gradual recovery.
Denmark underwent several structural changes within the government and financial sector, allowing for an eventual recovery. While certain factors such as the unemployment rate took years to return to its pre-crisis state, the enacted policies have continued to influence Denmark’s economy to this day.
Overall Macroeconomic Growth
This graph measures Denmark’s investment in long-lasting productive assets such as buildings, machinery, infrastructure, and equipment. Denmark’s investment share was relatively high in the late 1960s and early 1970s, fell sharply around the early 1980s, recovered unevenly, dropped again after the global financial crisis, and then rose during the late 2010s and early 2020s. This helps show how capital accumulation has fluctuated across different phases of Danish growth.
This graph is a labor-productivity measure. It shows how much output Denmark produces per employed person, measured in constant 2021 PPP dollars. The upward trend suggests that Denmark’s growth has not only come from employing more workers, but also from producing more output per worker. This connects Danish growth to human capital, technology, institutional quality, and specialization in high-value sectors.
Denmark’s economic growth shows high emphasis on investment and productivity. The GDP graph shows the overall expansion of the Danish economy. Gross fixed capital formation captures capital accumulation, while GDP per person employed captures labor productivity. Together, these graphs connect Denmark’s historical growth pattern to investment in productive capacity and rising output per worker.
The gross fixed capital formation graph shows that investment has been uneven over time. In the late 1960s and early 1970s, Denmark devoted a relatively high share of GDP to fixed investment, which fits the broader postwar European growth pattern of modernization, infrastructure expansion, and industrial development. The sharp fall around the early 1980s reflects a more difficult period in Denmark’s economy. Denmark was affected by the oil shocks and broader stagflationary pressures of the 1970s and early 1980s, which contributed to unemployment, public debt, and slower growth. The second oil crisis worsened Denmark’s terms of trade and contributed to rising unemployment and public debt.
The later movements in investment also help explain changes in Denmark’s growth path. Investment recovered in the mid-2000s, but then fell sharply around the global financial crisis. This suggests that Denmark’s productive-capacity growth was affected by broader global instability. The rebound after the mid-2010s shows a renewed strengthening of investment, which likely supported more recent growth.
The GDP per person employed graph shows a clearer long-run upward trend. Since the early 1990s, Denmark has produced more output per employed worker, meaning that growth has come partly from rising labor productivity. This can reflect better technology, stronger human capital, improved management, more efficient institutions, and movement into higher-value sectors. For a wealthy country like Denmark, this is especially important because long-run growth cannot depend mainly on population growth or simple industrialization. Once a country is already highly developed, sustained growth depends heavily on productivity improvements.
These two graphs also help interpret recent Danish growth. OECD describes Denmark’s recent economy as running at “two speeds,” with strong performance from large exporting firms, especially in pharmaceuticals, while domestic demand and some broader parts of the economy have been weaker. Denmark’s GDP growth can look strong even when the strength is concentrated in a few highly productive sectors, and the productivity graph helps capture this modern growth pattern. Denmark’s economy increasingly depends on high-value, globally competitive firms rather than broad growth across every sector.
Sources
Danish Ministry of Energy. (2017). Conclusions and recommendations. https://www.eng.em.dk/media/15681/conclusions-and-recommendations-170913.pdf
Economic History Association. (n.d.). An economic history of Denmark. EH.net. https://eh.net/encyclopedia/an-economic-history-of-denmark/
Euwals, R., Bosch, N., Deelen, A., & Andersen, T. M. (2011, April 8). The Danish flexicurity model in the Great Recession. CEPR VoxEU. https://cepr.org/voxeu/columns/danish-flexicurity-model-great-recession
Federal Reserve Bank of St. Louis. (2025, April 16). Inflation, consumer prices for Denmark. FRED. https://fred.stlouisfed.org/series/FPCPITOTLZGDNK
Gyntelberg, J., Kjeldsen, K., Nielsen, M. B., & Persson, M. (2012). The 2008 financial crisis and the Danish mortgage market. Wiley Online Library. https://onlinelibrary.wiley.com/doi/epdf/10.1002/9781119200505.ch3
International Monetary Fund. (n.d.). Denmark profile. https://www.imf.org/external/datamapper/profile/DNK
International Trade Administration. (2024, January 19). Denmark – market opportunities. Trade.gov. https://www.trade.gov/country-commercial-guides/denmark-market-opportunities
Karpestam, P. (2019). Interest-only mortgages and housing market fluctuations in Denmark. ScienceDirect. https://www.sciencedirect.com/science/article/pii/S1051137717300529
Karvounis, Nick (2017). [Copenhagen, Denmark][Photgraph]. Unsplash.com. https://unsplash.com/photos/two-gray-and-black-boats-near-dock-3_ZGrsirryY
Nielsen, Svend (2020). [Copenhagen Streets][Photograph]. Unsplash.com. https://unsplash.com/photos/people-walking-on-street-near-buildings-during-daytime-pDdJCVUn2jo
Organisation for Economic Co-operation and Development. (2024, January 9). OECD economic surveys: Denmark 2024. https://www.oecd.org/en/publications/oecd-economic-surveys-denmark-2024_d5c6f307-en.html
Organisation for Economic Co-operation and Development. (2026, January). OECD economic surveys: Denmark 2026. https://www.oecd.org/content/dam/oecd/en/publications/reports/2026/01/oecd-economic-surveys-denmark-2026_985d3771/3d6cb4b8-en.pdf
Rüdiger, M. (2014). The 1973 oil crisis and the designing of a Danish energy policy. Historical Social Research / Historische Sozialforschung, 39(4), 94–112.
Tax Foundation. (2020, March 26). Denmark coronavirus relief plan. https://taxfoundation.org/blog/denmark-coronavirus-relief-plan/
Schuppisser, Silvan (2021).[Denmark Coastline][Photograph].Unsplash.com. https://unsplash.com/photos/green-grass-field-near-sea-under-white-sky-during-daytime-R2fzDVNkJ6I
Varsbergs, Rolands (2019). [Copenhagen Skyline][Photgraph]. Unsplash.com. https://unsplash.com/photos/aerial-photo-of-boats-in-between-concrete-buildings-during-daytime-ePOH0oKeOjE
Winkler, Markus (2018). [Denmark Flag][Photograph]. Unsplash.com. https://unsplash.com/photos/white-and-red-flag-on-pole-qdrWX3HLTPk
World Bank. (n.d.). Unemployment, total (% of total labor force) (modeled ILO estimate) – Denmark. https://data.worldbank.org/country/denmark