Overview
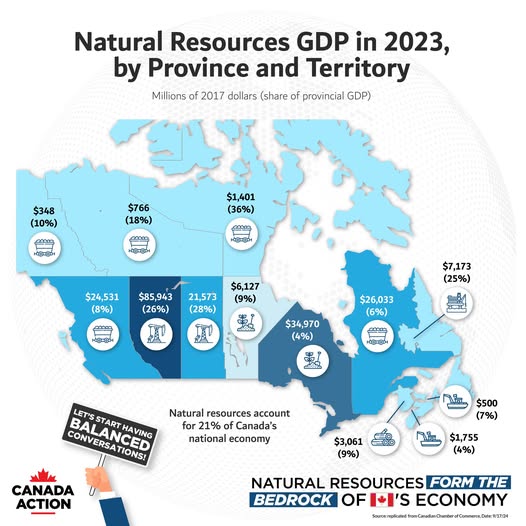
Canada, located in the northern part of North America, is the 10th largest economy in the world with a nominal GDP of 2.28 trillion USD. It is highly open and trade-dependent, with exports and imports representing a significant share of GDP, and the United States serving as its primary trading partner. As part of the G7, Canada has a diversified economy that combines a large service sector with strong natural resource industries, including oil, natural gas, mining, and forestry. Thus, Canada’s economy includes three many types of industries: services, manufacturing (with particular strengths in aircrafts, vehicles and machinery), and natural resources industries. Canada has experienced steady long-term economic growth, but it also goes through regular ups and downs. Major economic themes include managing inflation, responding to COVID-19 and more recently, the US tariffs, and dealing with house affordability challenges.
Macroeconomics Factors & Analysis
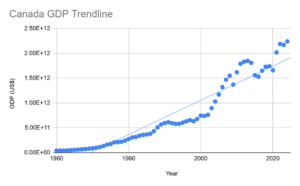
Canada’s GDP has many natural resources and has many exports like uranium, nickel, and zinc leading it to have much growth in the GDP in the past 60 years (Statista Research Department, 2025) . The drop in Canada’s GDP in 2009 was likely caused by the sudden drop in housing prices in the US. After a surge of investment into the housing market, housing prices dropped causing many people to have housing debts larger than the worth of their house. This led to the drop in prices of Canadian exports, including oil, which caused Canada to go into a recession (Gordon, 2017). Canada’s GDP growth slowed significantly in 2015 than in earlier years due to oil prices declining. Areas more connected to the energy sectors experienced more drops than other areas (Canada Energy Regulator, 2016). In 2020, the international pandemic caused many businesses to shut down, leading to a drop in the GDP. It was considered to be the biggest drop in GDP since the official comparison between countries’ GDP started in 1961 (Hudes, 2021).
Canada’s inflation history from 1960 to 2025 reflects periods of significant macroeconomic stress, policy missteps, and institutional learning. Inflation peaked at approximately 11% in 1974 and 12.5% in 1981, largely driven by the 1973 Arab oil embargo and subsequent supply shocks, contributing to a prolonged period of stagflation characterized by high inflation and weak economic growth (World Bank, 2024). During this period, delayed and inconsistent monetary tightening by the Bank of Canada exacerbated inflationary pressures before stronger disinflationary measures were implemented in the early 1980s (Bank of Canada, n.d.). More recently, inflation reached 6.8% in 2022, marking its highest level in nearly four decades, driven by post-pandemic demand recovery, global supply chain disruptions, and elevated energy prices (Bank of Canada, 2023; TD Economics, 2025). Looking ahead, the Bank of Canada remains committed to its 2% inflation target, emphasizing the importance of carefully calibrated monetary policy to maintain price stability amid ongoing global uncertainty and structural economic challenges (Bank of Canada, n.d.).
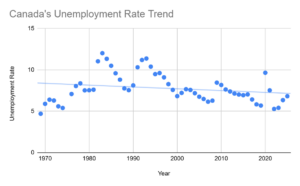
The unemployment rate data for Canada (World Bank) shows clear ups and downs that line up with major economic events. Unemployment was especially high in the early 1980s and early 1990s, when it rose above 11–12% during recessions. It increased again during the 2008–2009 financial crisis, though not as sharply. The biggest spike happened in 2020, when unemployment jumped to nearly 10% because of COVID-19, but it fell quickly as the economy reopened. In the most recent data, the rate sits around the mid-6% range, suggesting that the labor market has largely recovered.
Policy Changes
The Canada Emergency Response Benefit (CERB) was rolled out in March 2020 when the COVID-19 pandemic caused massive job losses and economic uncertainty across Canada. The policy provided $2,000 per month to workers who suddenly lost income due to lockdowns, business shutdowns, or illness. It came at a time when the economy was shrinking quickly and people were cutting back on spending because of lost wages and uncertainty. CERB helped stabilize household incomes and gave people the ability to keep paying for essentials like rent, food, and bills. Because it directly increased people’s spending power, CERB mainly affected aggregate demand, helping to push it back up during a sharp downturn.
AS-AD Model Applied to Real World Policies
Model-Based Analysis and Predictions
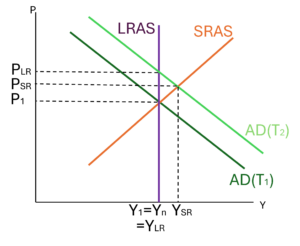
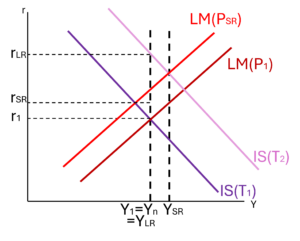
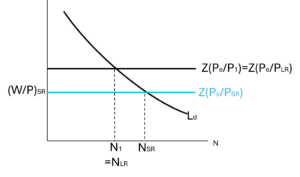
The decrease in taxes shifts the AD curve inward, causing prices to rise in the short run, rise more in the long run, and cause output to increase the in short run. Output in the long run does not change. Because of the decreases in taxes, the IS curve will shift outward. However, the increase in price causes the LM curve to shift inward to get us to our short run equilibrium. These shifts cause interest to rise in the short and long run. We can see from the graph that the interest is higher in the long run than in the short run. With the increase in prices, we also see our labor supply curve shift down. This means nominal wage decreases and labor increases in the short run. However, in the long run, expected price is equal to the price level, so the labor supply curve is returned to its original spot. This means nominal wages and labor do not change from the original position to the long run. Since our interest is increasing in both the short and long run, investment must be decreasing during both. Since interest is higher in the long run than the short run, investment is lower in the long run than the short run. We know that output depends on consumption, investment, government spending, and net exports. Since government spending and net exports are not changing, we can disregard them for now. Since investments are decreasing, we would assume that output is also decreasing. However, we know that output is increasing in the short run, so it must be that consumption is increasing during the short run. In the long run, we know that interest is increasing while all else stays the same, so consumption is decreasing. From the short to the long run, we know that output is decreasing and interest is increasing, so consumption in the long run is less than consumption in the short run.
Comparison with Real Economic Outcomes
- GDP: Canada experienced a sharp decline (-5%) in GDP in early 2020 due to lockdowns, followed by a strong recovery (+6%) later in 2021;
- Unemployment: Unemployment spiked significantly (+4%) at the start of the pandemic, then gradually declined as the economy reopened;
- Consumption: Household spending was supported despite job losses due to government transfers like CERB;
- Poverty/income stability: Emergency transfers prevented a much larger drop in household income, maintaining the economy;
Comparison with AD–AS predictions
CERB acts as an expansionary fiscal policy, increasing disposable income -> AD shifts right.
What we expected:
- Increase in output (GDP)
- Lower unemployment
- Potential upward pressure on prices.
What actually happened:
In the short run, GDP still fell due to supply shocks (lockdowns), which the AD–AS model alone does not fully capture
However, CERB softened the recession by sustaining demand. As restrictions eased, output recovered faster, consistent with AD stimulus
Inflation remained relatively contained initially, because the economy had slack
The outcomes are partially consistent with AD–AS model. The model correctly predicts demand support, but it fails to capture the simultaneous negative supply shock from COVID-19. So, CERB helped shift AD right, but AS was also shifting left at the same time.
Discrepancies and Interpretation
The real economy did not fully match AD–AS predictions because COVID-19 created both a demand and a supply shock at the same time. CERB increased aggregate demand by giving people income, but lockdowns and supply chain disruptions shifted aggregate supply left, limiting production. That’s why GDP still fell in the short run, even with expansionary policy. On top of that, other policies (like business support and low interest rates) and high uncertainty meant people didn’t always spend immediately. This shows a key limitation of the AD–AS model: it doesn’t handle sudden supply shocks or behavioral changes very well. A more complete explanation would include supply constraints, expectations, and crisis conditions.
The Canada Child Benefit (CCB) expansion began in July 2016 as part of a broader effort to support families and reduce child poverty. It replaced older programs with a tax-free monthly payment that gave more money to low- and middle-income families. This policy was introduced during a relatively stable economic period, but with concerns about inequality and affordability for families. By increasing disposable income, especially for families more likely to spend that money, it boosted consumer spending in the economy. So, like CERB, it mainly affected aggregate demand, although in the long run it could also improve aggregate supply by supporting better outcomes for children (like health and education), which can lead to a more productive workforce.
AS-AD Model Applied to Real World Policies
Model-Based Analysis and Predictions
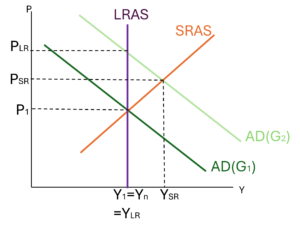
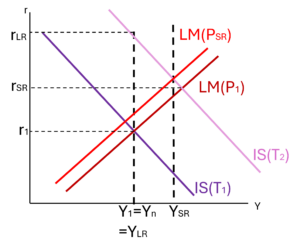
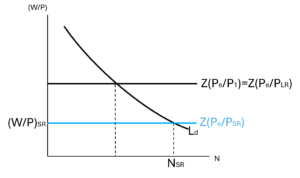
The increase in government spending shifts the AD curve outward. This increases prices in the short and long run, though greater in the long run. It also increases the output in the short run. Output in the long run is the same as the original output. The increasing in government spending also shifts the IS curve outward. However, the increase in prices in the short run will shift the LM curve inward to reach the short run equilibrium output. These shifts cause the interest to rise in both the short and long run. We can see from the IS-LM graph that the increase in interest is greater in the long run than the short run. The increase in prices causes the labor supply curve to shift down. This means that nominal wages decrease and labor increases in the short run. Once we’re in the long run, price is equal to expected price, so the labor supply curve is returned to the original spot. This means labor and nominal wages do not change from the original levels. Since the interest is increasing in the short and long run, investment is decreasing. Because interest is higher in the long run than the short run, investment is lower in the long run than the short run. From the original production to the long run, only interest is changing by increasing. This means consumption is decreasing from the original amount to the long run. To see what is happening in the short run, we can look at the function to find output. We know that it depends on consumption, investment, government spending, and net exports. From the short run to the long run, government spending and net exports are fixed, so we are going to currently ignore them. We also know that investment is decreasing which would normally imply that output is decreasing, but we know it is not. This must then mean that consumption is increasing during this time. That is, consumption in the long run is lower than consumption in the short run. From the original position to the short run, we know that output and interest are increasing which gives us an ambiguous answer for how consumption is changing. Similarly, we know that government spending is increasing, so we look at the formula for output, and we see that output is increasing, we cannot immediately credit that change to consumption. Thus, this change is ambiguous.
Comparison with Real Economic Outcomes
- Child poverty fell significantly; about 300,000 children were lifted out of poverty
- GDP / economic activity: Each $1 transferred generated about $1.97 in economic activity
- Employment & growth: Canada experienced economic growth, low unemployment, and stable inflation in the years after implementation
- Consumption: Increased spending by families (especially lower-income households with higher marginal propensity to consume.
Comparison with AD–AS predictions
CCB increases disposable income -> AD shifts right
What we expected:
- Higher GDP
- Lower unemployment
- Mild inflationary pressure
What actually happened:
Economic growth increased -> consistent
Unemployment reached low levels -> consistent
Inflation remained low and stable -> suggests the economy had capacity (flat AS or slack)
The outcomes are strongly consistent with AD–AS predictions. The policy increased aggregate demand without causing major inflation, likely because the economy was below full capacity.
Discrepancies and Interpretation
The outcomes mostly matched AD–AS, but there are still a few things to explain. Even though demand increased, inflation stayed low. This likely happened because the economy had slack (unused capacity) and stable inflation expectations, so prices didn’t rise much. The policy was also gradual and predictable, so it didn’t cause a sudden surge in demand. Broader factors like low interest rates and steady growth helped too. While AD–AS gets the general story right, adding ideas like a flatter supply curve or stable expectations helps explain why inflation stayed so controlled.
Extreme Macroeconomic Event - COVID 19
Historical Context
The COVID-19 recession in Canada began in early 2020, following the global spread of COVID-19. In March 2020, governments introduced strict lockdowns, travel restrictions, and business closures to contain the virus. These measures caused a sudden halt in economic activity, especially in sectors like hospitality, retail, and travel. As a result, Canada entered one of the sharpest and fastest recessions in its history.
Leading up to the crisis, Canada’s economy was relatively stable, with moderate growth, low unemployment, and steady inflation. However, the economy was also highly exposed to global trade and commodity markets, particularly oil. When the pandemic hit, global demand collapsed and supply chains were disrupted, amplifying the downturn. Financial markets also experienced high volatility, and uncertainty about the duration of the pandemic further reduced consumer and business confidence.
Macroeconomic Impacts
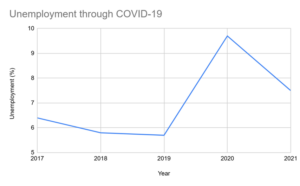
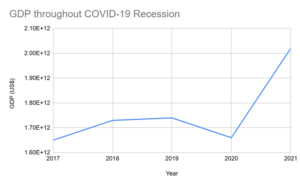
The COVID-19 recession had severe effects on key macroeconomic variables. Real GDP contracted sharply in 2020 with a 5.05% decline from 2019. Unemployment spiked dramatically, rising from about 5.7% in 2019 to over 9.7% in 2020. Inflation initially fell to 0.7% from 1.9% due to weak demand, though it later rebounded to 6.8% as the economy reopened. At the same time, government spending surged, leading to a significant increase in public debt. The Canadian dollar also experienced volatility, partly due to falling oil prices and global uncertainty.
The shock propagated through both demand and supply channels. On the demand side, lockdowns and uncertainty caused a sharp drop in consumer spending and business investment, shifting aggregate demand left. On the supply side, business closures and disruptions to production reduced output capacity, shifting short-run aggregate supply left as well. This combination created a deep but relatively short-lived contraction. Financial markets and labor markets amplified these effects, as layoffs reduced income and further weakened spending.
Data and Visualization
From the graphs, we can see that GDP was increasing and unemployment was decreasing in the years leading up to the COVID-19 recession. Then, when the recession hit, GDP fell and unemployment spiked. We can see that the GDP was not hit as significantly as it only decreased to where it was a few years prior. Additionally, it was able to increase to higher than it was before the recession in the next few years. This shows that while the recession did impact GDP, the counter active measures were able to help smooth the process. However, the unemployment rate was much higher than it had been in the years leading up to the recession. It also took longer for it to recover back to lower rates than the GDP. This shows how the recession and the countermeasures taken did not work as well as they did for the GDP.
Policy Response and Aftermath
The Canadian government and the Bank of Canada responded aggressively to stabilize the economy. Fiscal policy included large income support programs such as the Canada Emergency Response Benefit (CERB), wage subsidies for businesses, and increased healthcare spending. These measures aimed to support household income and prevent widespread business failures.
Monetary policy also played a key role. The Bank of Canada rapidly lowered interest rates to near zero and implemented quantitative easing to support financial markets and encourage lending. These policies helped stabilize demand and reduce borrowing costs.
As a result of these combined efforts, the Canadian economy began recovering in late 2020 and continued into 2021. However, the recovery brought new challenges, including rising inflation and higher public debt levels.
Analysis of Economic Growth
Overview of Growth Patterns
Canada’s long-run economic growth shows a general upward trend, meaning that the country became much richer over time in terms of total GDP and GDP per capita. However, this growth was not constant or evenly distributed. Canada experienced rapid growth during the late 1800s and early 1900s, when railway expansion, immigration, western settlement, and wheat production helped expand the economy. Another strong period came after World War II, when manufacturing, urbanization, public investment, and rising consumer demand supported fast growth, especially in Central Canada. At the same time, Canada also experienced periods of stagnation and decline, especially during the Great Depression, the recessions of the early 1980s and early 1990s, the 2008 financial crisis, and the COVID-19 shock. Overall, the long-run data suggest that Canada’s economy expanded significantly, but growth happened in waves and was shaped by regional differences, global demand, industrialization, and major economic shocks.
The regional story helps explain why this growth pattern was uneven. Atlantic Canada was important in the early economy because of fisheries, timber, shipbuilding, and maritime trade, but it later grew more slowly than other parts of the country. Central Canada, especially Ontario and Quebec, became the core of industrialization, manufacturing, finance, urban growth, and later services. Western Canada expanded through railways, agriculture, wheat, immigration, mining, oil, and gas, which made the region very important to Canada’s national output. The North had a smaller population, but it contributed through mining, energy, territorial expansion, and resource extraction. This shows that Canada’s growth should not be understood only as one national trend, but as a national process built from different regional economies that became important at different times.
Drivers of Economic Growth
One of the biggest drivers of Canadian growth was natural resources. In the early period, Canada’s economy depended heavily on staples such as fish, fur, timber, wheat, minerals, and later oil and gas. Atlantic Canada contributed through fisheries, timber, and maritime trade, while Western Canada became central through wheat, mining, and energy. This made exports very important to Canadian growth, but it also meant that parts of the economy were vulnerable to changes in global demand and commodity prices.
Another major driver was capital accumulation, especially railways, infrastructure, factories, cities, and later energy and transportation networks. Railways were especially important because they connected different regions, opened the West to settlement, and made it easier to move people and goods across the country. In Central Canada, investment in factories, finance, and urban infrastructure helped Ontario and Quebec become the main industrial region of the country.
Labor force growth and human capital also mattered a lot. Immigration helped expand the population, especially during western settlement, and gave Canada more workers, farmers, consumers, and entrepreneurs. Over time, education and skills became more important as the economy moved away from only farming and resource extraction toward manufacturing, services, finance, and technology.
Productivity and technological change became more important over time too. Early growth depended more on land, labor, and natural resources, but later growth came increasingly from better transportation, mechanized production, more efficient factories, improved education, and new technologies. This helped Canada produce more output per worker and supported higher living standards.
Finally, structural transformation and policy changes shaped growth. Canada moved from a resource-based and agricultural economy toward manufacturing, and later toward services and higher-value industries. Government decisions also mattered, including Confederation, railway policy, trade policy, western expansion, public investment, and resource development in the North. Overall, Canada’s growth came from a mix of resources, infrastructure, immigration, productivity, industrialization, and policy, but the importance of each factor changed over time.
Data and Visualization
These charts show us the GDP and unemployment rate trends through the past few decades. Despite the different recessions and hardships the country had gone through, the GDP was able to sustain an increasing trend, and the unemployment rate had a decreasing trend throughout it. This shows us that these recessions were not able to completely off put the economy. That is, despite the difficulties that were experienced through the recession, Canada was still able to grow throughout the decades. Canada has figured out how to sustain growth and help minimize hardships.
Interpretation
Throughout all of the different periods of Canada’s history, Canada has worked to ensure that its economy is able to be sustained over a long period of time. When an event like a war occurs in the country, the economy experiences an unplanned shock to deal with the changing conditions. When policy-makers make decisions on what should change in the economy, they are causing a planned shock. All types of shocks change the variables in the economy, leading to changes in how productive the economy is during that period. Looking into the events surrounding wars and policy decisions Canada has gone through, we are able to see their effect on the whole of the economy. This allows Canada to use this knowledge to guide future decisions on the economy to continue its growth. For example, in studying the variables like GDP and unemployment surrounding the COVID-19 recession, we are able to see how the countermeasures were able to help and how they could have been improved.
Sources (APA Style)
Bank of Canada. (2023). The Bank of Canada’s response to high inflation. Bank of Canada. Retrieved from https://www.bankofcanada.ca/publications/annual-reports-quarterly-financial-reports/annual-report-2022/the-bank-of-canadas-response-to-high-inflation/
TD Economics. (2025). Canadian inflation: A new vintage. TD Bank Group. Retrieved from https://economics.td.com/ca-inflation-new-vintage
Bank of Canada. (n.d.). Inflation in Canada. Bank of Canada. Retrieved from https://www.bankofcanada.ca/core-functions/monetary-policy/inflation/
Canada Energy Regulator. (2016, September 15). Market Snapshot: Crude oil price downturn has varied economic impact across Canada. Canada Energy Regulator. https://www.cer-rec.gc.ca/en/data-analysis/energy-markets/market-snapshots/2016/market-snapshot-crude-oil-price-downturn-has-varied-economic-impact-across-canada.html
Canadian Association of Petroleum Producers. (n.d.). Energy and the Canadian economy. CAPP. https://www.capp.ca/en/our-priorities/energy-and-the-canadian-economy/
GDP by Country (2025). (n.d.). Worldometer. Retrieved February 21, 2026, from https://www.worldometers.info/gdp/gdp-by-country/
Gordon, S. (2017, October 24). Recession of 2008–09 in Canada. The Canadian Encyclopedia. Retrieved February 21, 2026, from https://www.thecanadianencyclopedia.ca/en/article/recession-of-200809-in-canada
Hudes, S. (2021, March 21). Canadian economy contracted 5.4% in 2020, worst year on record. Advisor.ca. Retrieved February 21, 2026, from https://www.advisor.ca/economy/economic-indicators/canadian-economy-contracted-5-4-in-2020-worst-year-on-record/
Schultz, A. (2025, April 11). Discover Canada – Canada’s Economy. Canada.ca. Retrieved February 21, 2026, from https://www.canada.ca/en/immigration-refugees-citizenship/corporate/publications-manuals/discover-canada/read-online/canadas-economy.html
Statista Research Department. (2025, December 17). Gross Domestic Product of Canada – Statistics & Facts. Statista. https://www.google.com/url?q=https://www.statista.com/topics/5980/gross-domestic-product-of-canada/%23topicOverview&sa=D&source=docs&ust=1771705376386082&usg=AOvVaw3narvERUH6m9WhcUCPafr_
World Bank. (2024). Inflation, consumer prices (annual %): Canada. World Bank Data. Retrieved from https://data.worldbank.org/indicator/FP.CPI.TOTL.ZG?end=2024&locations=CA&start=1960&view=chart&year=2024
World Bank. (2024) Unemployment, total (% of total labor force) (national estimate) – Canada. World Bank. Retrieved from
https://data.worldbank.org/indicator/SL.UEM.TOTL.NE.ZS?locations=CA
Canadian Centre for Economic Analysis. (2019, September 19). Economic contribution of the Canada Child Benefit: A basic income guarantee for Canadian families with children. https://www.cancea.ca/index.php/2019/09/19/economic-contribution-of-the-canada-child-benefit-a-basic-income-guarantee-for-canadian-families-with-children/
Government of Canada. (2018). Canada Child Benefit: Fiscal impact and outcomes. https://web.archive.org/web/20180514212214/https://www.fin.gc.ca/n18/data/18-008_4-eng.asp
UBI Works. (n.d.). Canada Child Benefit (CCB). https://www.ubiworks.ca/ccb
Government of Canada. (2016). G20 growth strategy: Canada. https://www.international.gc.ca/world-monde/international_relations-relations_internationales/g20/2016-Growth_Strategy-Strategie_Croissance.aspx?lang=eng
Canada Revenue Agency. (2022, November 8). Canada Emergency Response Benefit (CERB). Government of Canada. https://www.canada.ca/en/revenue-agency/services/benefits/apply-for-cerb-with-cra.html
Bank of Canada. (2020, May). Financial System Review—2020. https://www.bankofcanada.ca/2020/05/financial-system-review-2020/
Canada Revenue Agency. (2016). You have children? The new Canada Child Benefit may affect your family. Government of Canada. https://www.canada.ca/en/revenue-agency/news/newsroom/tax-tips/tax-tips-2016/you-have-children-new-canada-child-benefit-may-affect-your-family.html
Statistics Canada. (2017). Income statistics and redistribution in Canada. https://www150.statcan.gc.ca/n1/pub/11-627-m/11-627-m2017006-eng.htm
The Canadian Encyclopedia. (n.d.). Economic history. https://thecanadianencyclopedia.ca/en/article/economic-history
The Canadian Encyclopedia. (n.d.). Economic history of Central Canada. https://thecanadianencyclopedia.ca/en/article/economic-history-of-central-canada
The Canadian Encyclopedia. (n.d.). Economic history of Atlantic Canada. https://thecanadianencyclopedia.ca/en/article/economic-history-of-atlantic-canada
The Canadian Encyclopedia. (n.d.). Economic history of Western Canada. https://thecanadianencyclopedia.ca/en/article/economic-history-of-western-canada
Open TextBC. (n.d.). 9.3 The North: Economy and territory. In Canadian history: Post-Confederation. https://opentextbc.ca/postconfederation/chapter/9-3-the-north-economy-and-territory/
The Canadian Encyclopedia. (n.d.). Canada West. https://thecanadianencyclopedia.ca/en/article/canada-west
Open TextBC. (n.d.). Canadian history: Post-Confederation. https://opentextbc.ca/postconfederation/
Open TextBC. (n.d.). 9.6 The Atlantic Colonies. In Canadian history: Pre-Confederation (2nd ed.).
https://opentextbc.ca/preconfederation2e/chapter/9-6-the-atlantic-colonies/
Department of Finance Canada. (2020). Overview of Canada’s COVID-19 economic response plan. Government of Canada. https://www.canada.ca/en/department-finance/services/publications/economic-fiscal-snapshot/overview-economic-response-plan.html
Bank of Canada. (2020). Monetary policy report: December 2020. Bank of Canada.
Macrotrends. Canada GDP (gross domestic product). https://www.macrotrends.net/global-metrics/countries/can/canada/gdp-gross-domestic-product