Norway
Macroeconomic Overview
Norway is a Northern European nation located on the Scandinavian Peninsula and is widely regarded as one of the wealthiest and most economically advanced countries in the world. With a population of approximately 5.6 million people and a nominal GDP of $438 billion in 2024, Norway consistently ranks among the highest in the world for standard of living and economic prosperity. The economy is anchored by several major industries including oil and natural gas extraction, hydropower, fisheries, and shipping, with petroleum being the single largest revenue generator since North Sea oil was discovered in the late 1960s. A defining feature of Norway’s economic model is the Government Pension Fund Global, commonly known as the “oil fund,” which channels petroleum revenues into the world’s largest sovereign wealth fund, acting as a long-term financial cushion for future generations. Unemployment remains low at around 2-5%, reflecting one of the most stable labor markets in Europe. The key macroeconomic challenge Norway faces is balancing its continued reliance on petroleum with the need to transition toward a more diversified, sustainable economy in the face of growing global climate pressures and shifting energy markets.
Sources: World Bank, World Development Indicators (WDI), GDP (current US$), Norway, World Bank, World Development Indicators (WDI), Population, total, Norway, Statistics Norway (SSB) (2025), Norwegian Economy: Proceeding at a Normal Pace, Norges Bank (2024), The Government Pension Fund Global, Norges Bank Investment Management (NBIM), About the Fund.
Macroeconomic Indicators
GDP and economic growth
Norway’s real GDP has increased steadily between 1978 and 2025 primarily due to the expansion of the petroleum sector and the state’s fiscal stabilization framework. Nevertheless, there are still some fluctuations over time. Evidence from Norges Bank and Statistics Norway show that downturns correspond to identifiable macroeconomic shocks: the 1986 oil price collapse, banking crisis between 1988 and 1992, the 2008 global financial crisis, the 2014 oil investment decline, and the 2020 pandemic.
However, unlike most resource-dependent economies, Norway experienced mild recessions because petroleum revenues were saved in the sovereign wealth fund and spent counter-cyclically (Government Pension Fund Global, Handlingsregelen). Recent growth after 2022 reflects strong European demand for Norwegian natural gas. Overall, the data illustrate a resource-rich economy stabilized by fiscal institutions, producing steady long-term growth with short temporary declines.
Not limited to Norway, the Nordic countries (Norway, Sweden, Denmark, Finland, and Iceland) maintain high GDP per capita through abundant natural resources, high-trust and stable democratic institutions, and the “Nordic model.” According to the IMF’s 2025 GDP per capita rankings, four of the five Nordic countries are in the top 20 (Iceland 7th, Norway 10th, Denmark 13th, and Sweden 20th), while the United States ranks 11th and the United Kingdom 27th. All five countries are within the top 30, with Finland ranking 28th. The Nordic model, often described as flexicurity, combines high, progressive taxation with robust social safety nets, reducing income inequality while promoting economic efficiency, high labor-force participation, and social mobility.
Data: FRED. (2026, January 20). Real Gross Domestic Product for Norway. https://fred.stlouisfed.org/series/CLVMNACSCAB1GQNO#.
Additional References:
Norges Bank. (2020, November 23). History of Norges Bank. https://www.norges-bank.no/en/topics/about/history/history-of-norges-bank/
Statistics Norway. (2009, February 19). Economic trends for Norway and abroad: Major slowdown. https://www.ssb.no/en/nasjonalregnskap-og-konjunkturer/artikler-og-publikasjoner/major-slowdown
IMF. (2025, October). World Economic Outlook: Global Economy in Flux, Prospects Remain Dim. https://www.imf.org/en/publications/weo/issues/2025/10/14/world-economic-outlook-october-2025
Major Industries
Norway’s economy is significantly impacted by its ocean basins: the North Sea, the Norwegian Sea, and the Barents Sea. The major industries in Norway are oil and gas sectors, along with shipping, shipbuilding, tourism, hydro-power, and aquaculture. In recent years, green technologies, information and communication technologies, and light metals and other energy intensive industries have increased. The largest industry is the petroleum sector which has grown extensively since the discovery of oil in 1969. As of 2021-2023, the sector accounts for 24% of GDP, 19% of total investments, 36% of state revenues, and 52% of total exports (not including the service and supply industry). Norway is the 8th largest natural gas producer in the world and ranks as the 4th largest exporter of natural gas globally.
There have been several spikes and drops in the industry over time. Norwegian oil production peaked in 2001 and then started declining, but it has been stable since 2011. In 2024, oil liquid production (crude, NGL, condensate) was about 2 millions barrels a day. The value of Norwegian gas exports was higher than oil liquid exports in 2024. In 2022, Norway became Europe’s biggest gas supplier and increased production after Russia invaded Ukraine. Domestic consumption of gas in Norway is low and nearly all gas produced is exported. The production level of gas is expected to remain stable until 2030, when production levels will begin to decline.
Data: Norwegian Petroleum. (2026, February 20). Exports of Oil and Gas.
Additional References:
International Trade Administration. (2024, January 20). Norway Country Commerical Guide: Offshore Energy – Oil, Gas, and Renewables.
International Trade Administration. (2024, January 20). Norway Country Commerical Guide: Market Overview.
World Atlas. (2019, March 22). What are the Biggest Industries in Norway?.
U.S. Energy Information Administration. (2024, August 21). Norway. U.S. Department of State. 2024 Investment Climate Statements: Norway.
Population And Demographic
Norway’s population has grown steadily since 1960, rising from approximately 3.6 million to over 5.5 million by 2024. Growth was gradual through the 1960s–80s, before accelerating noticeably from the early 2000s onward. This acceleration was largely driven by a surge in immigration, as Norway’s oil boom and its membership in the European Economic Area made it an attractive destination for workers, particularly from Eastern Europe.
More recently, population growth has continued but at a somewhat slower pace, with Norway’s total population now sitting at approximately 5.6 million as of 2024. While Norway remains a small country by global standards, its steady growth has been a net positive for the labor force and broader economic output. However, an aging population is emerging as a longer-term macroeconomic concern. As the share of retirees grows relative to the working-age population, Norway may face increasing pressure on its generous welfare and pension systems.
Data: World Bank, World Development Indicators (WDI), Population, total.
Additional references:
Statistics Norway (SSB) (2024), Population and Population Changes.
Statistics Norway (SSB) (2023), Immigration and Immigrants in Norway.
United Nations, Department of Economic and Social Affairs (2024), World Population Prospects.
Unemployment Rate
Norway’s unemployment rate follows clear economic cycles. In the mid-1970s, unemployment was below 2%. It then increased through the 1980s and peaked above 6% in the early 1990s during a period of banking Crisis. After that, unemployment declined, rose again in the early 2000s, and since around 2010 has mostly fluctuated between 3% and 5%. Overall, while Norway experiences normal economic ups and downs, unemployment has generally stayed low compared with many other countries.
Recently, unemployment in Norway has increased, even though the economy is improving. This rise is largely explained by growth in the labour force. More people are entering the workforce due to high immigration, higher participation rates, and continued demand in sectors such as services and energy. Statistics Norway notes that much of the recent increase in unemployment is due to this higher labour supply rather than a sharp decline in jobs. Even with this increase, Norway’s unemployment rate remains below the euro area average of 6.2% and the EU average of 5.9% as of December 2025. Looking ahead, Statistics Norway expects unemployment to fall gradually, from about 4.5% this year to around 4% by 2028, as economic growth continues.
Policy Analysis Using Macroeconomic Models
Expansionary Fiscal Policy
Increase in Government Spending
In January 2009, Norway implemented an expansionary fiscal policy in response to the global downturn caused by the 2008 Financial Crisis. The government increased public spending as part of a stimulus package aimed at supporting economic activity and stabilizing the economy.
This policy was introduced during a period of significant economic uncertainty and declining global demand.
As a small open economy with strong ties to international markets, Norway was vulnerable to these external shocks.
From a macroeconomic perspective, this policy, Increase in government spending (G) primarily affects aggregate demand (AD).
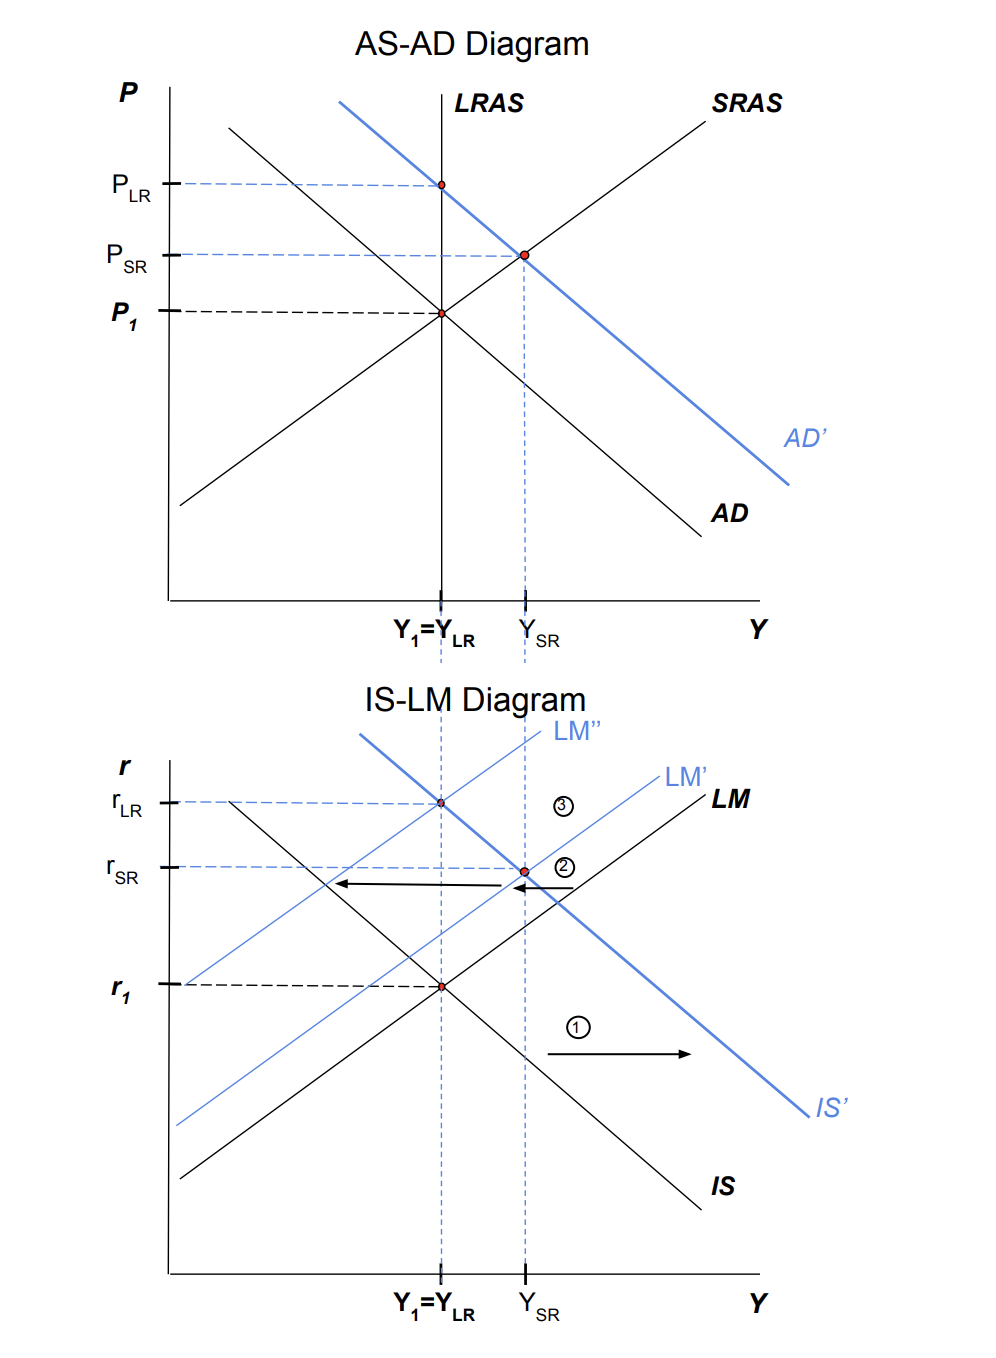
The expected effects of the policy
- Increase in price and interest rates.
- Temporary increase in output.
- Decrease in investment.
- Ambiguous outcome in Short term and a Decrease in long run consumption
- Temporary increase in labor.
- Temporary decrease in real wages.
AS-AD Diagram
An increase in government spending affects aggregate demand by shifting the AD curve outward. It will lead to a higher price in both the short run and the long run, and higher output for the short run, and going back to the original point in the long run.
IS-LM Diagram
IS curve shifts outward which is caused by an increase in G and then shifts the LM curve inward by higher P in the short run. In the long run, it shifts the LM curve further inward by even higher P.
Labor Market Diagram
In the labor market, the real wage in the short run goes down, and labor goes up due to an increase in P. However, in the long run, the real wage and labor go back to the original points because the expected price is adjusted to the change in P.
How successful was the model?
According to FRED data, The Real GDP for Norway increased in both the short term and the long term.
Short term – According to FRED data, real GDP for Norway initially decreased from 661,388 million euros in Q1 2009 to 657,171 million euros in Q2 2009. However, by Q1 2010, GDP had increased to 671,595 million euros. This pattern is consistent with the short-run predictions of the AD–AS model, where an expansionary policy leads to a recovery in output following an initial downturn.
In the long run, real GDP continues to increase, reaching 799,161 million euros in 2019. While the AD–AS model predicts that output returns to its natural level, this does not imply that GDP must fall back to its previous level. Instead, the natural level of output can grow over time due to factors such as technological progress and capital accumulation. Therefore, the continued increase in real GDP is not inconsistent with the model.
https://data.worldbank.org/indicator/FR.INR.RINR?end=2024&locations=NO&start=2013&view=chart
According to the model, in the short run, the effect on consumption is ambiguous. Ambiguity is caused by a predicted increase in output and an increase in interest rate. In reality, we saw consumption increase as interest rates decreased and output increased. We saw an increase in both the short run and long run, which is inconsistent with the model.
https://data.worldbank.org/indicator/NE.CON.TOTL.KN?end=2019&locations=NO&start=2009
The investment can be measured by gross fixed capital formation as a percentage of GDP. In the short run, it decreased from 23% in 2009 to 21% in 2010. In the long run, it consistently increased to 27%, rather than decreasing further. Possible reasons can be the trend of increasing investment for clean energy infrastructure, partially supported by the government spending itself.
https://data.worldbank.org/indicator/NE.GDI.FTOT.ZS?end=2010&locations=NO&start=2008
Labor can be measured by total employment. In the short run, employment (15 years old or over) increased from 2,509,894 persons in 2009 to 2,514,409 persons in 2010. In the long run, it increased further and consistently to 2,728,536 persons in 2019. It does not exactly align with the prediction we made from the model, as it was supposed to go up and then back to the original point. The possible reasons can be the recovery from the 2008 financial crisis that encouraged firms to hire more workers; the government spending that supported public sector employment; and Norway’s stable labor market institutions and growth in sectors, such as construction and services, that contributed to sustained employment growth in the long run.
Although the real wage increased 1.5% in 2010 from the previous year, it is a weak increase compared to the years before and after the financial crisis. In the long run, the real wage increased by about 12% between 2009 and 2020, but the growth was modest and uneven. The deceleration of the real wage growth partially aligns with the model’s prediction of a decrease in the short run. In the long run, economic recovery and productivity growth pushed the real wage upward, but it fluctuated with different factors, such as the oil price shock in 2014.
https://www.ssb.no/149409/annual-earnings.nominal-and-real-values.average-for-all-employees
Discrepancies and Interpretation
The AD-AS, IS-LM, and labor market models provided a useful framework and were able to predict some changes following the expansionary fiscal policy of Norway in 2009.
The models correctly predicted Price changes and Short-run output increase.
The model had multiple discrepancies.
In the long run, real GDP continues to increase, reaching 799,161 million euros in 2019. While the AD–AS model predicts that output returns to its natural level, this does not imply that GDP must fall back to its previous level. Instead, the natural level of output can grow over time due to factors such as technological progress and capital accumulation. Therefore, the continued increase in real GDP is not fully inconsistent with the model.
It is important to note that Inconsistency in terms of interest rates was caused by Norges Bank cutting interest rates and having a strong expansionary monetary policy. Increase in consumption, both long and short term, can be explained by the decrease in interest rates.
There are also several discrepancies in the changes in investment, labor, and real wages in reality. Those outcomes different from the model predictions come from a variety of reasons, such as the effect of the financial crisis itself rather than the fiscal policy implemented after; some real-world-specific trends in investment, including an increase in investment for renewable energy; and a more long-run trend in an increase in the real wage due to economic recovery and productivity growth.
Our Conclusion
While the observed outcomes were not fully consistent with the model’s predictions, it is important to note that the analysis of the effect of increased government spending was conducted. In reality, the economy was already affected by the 2008 financial crisis, and additional policies such as expansionary monetary policy were implemented simultaneously. These factors influenced the observed outcomes. This highlights the limitations of the AD-AS framework in capturing real-world complex economic dynamics, particularly simultaneous policy changes and external shocks.
Contractionary Monetary Policy
Decrease in Money Supply
In 2022, Norges Bank implemented a contractionary monetary policy by raising interest rates multiple times throughout the year. The policy involved increasing the policy rate from near zero to around 2.75% in order to slow down economic activity. This policy was introduced in a context of rising inflation, driven by strong post-pandemic demand and higher global energy prices. Inflation in Norway had moved above the central bank’s target, creating concern about sustained price increases and overheating in the economy. This policy primarily affects aggregate demand, as higher interest rates reduce consumption and investment by making borrowing more expensive, which in turn lowers overall demand in the economy.
From a macroeconomic perspective, this decrease in money supply (M) shifts the aggregate demand (AD) curve in.
AD-AS Model
IS-LM Model
Labor Market Model
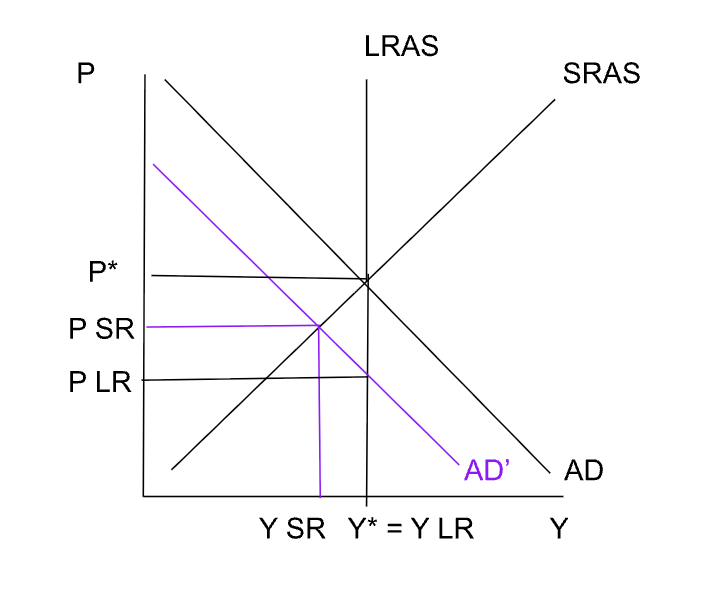
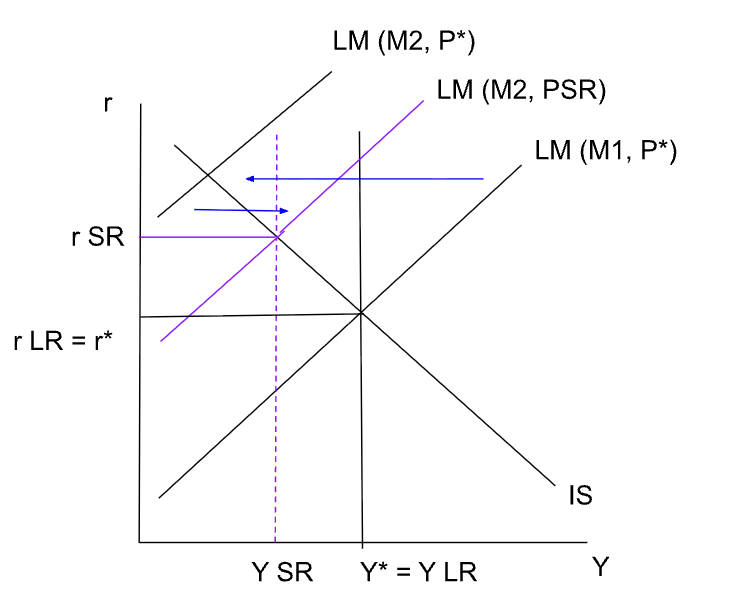
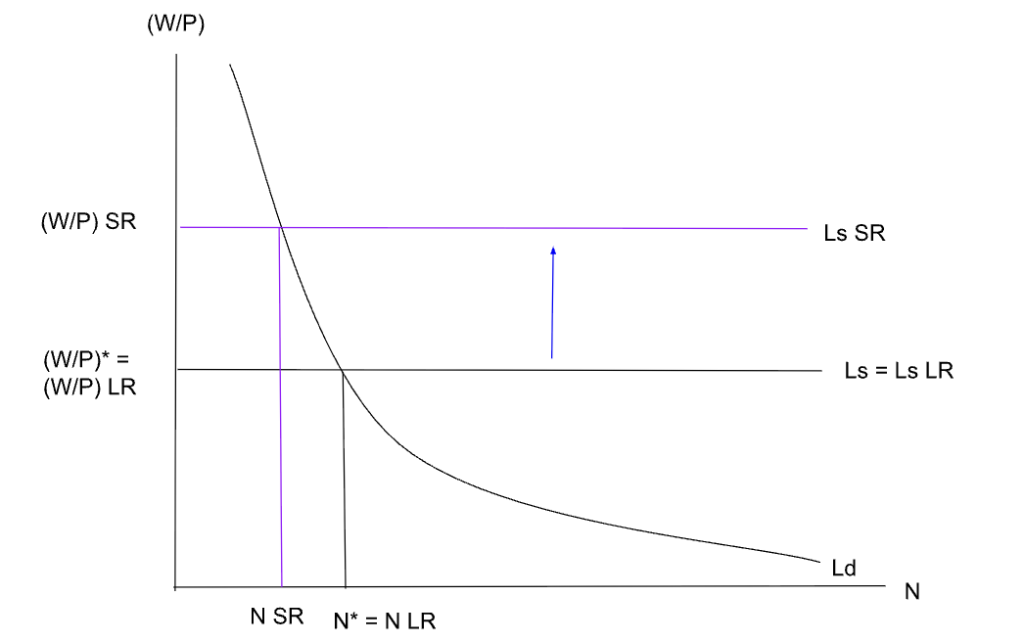
Using the AD-AS, IS-LM, and labor market models, the contractionary monetary policy implemented by Norges Bank in 2022 leads to a slowdown in economic activity. In the AD-AS model, higher interest rates reduce consumption and investment, causing aggregate demand to shift left (AD -> AD’). This results in a decrease in both output (from Y* to Y SR) and the price level (from P* to P SR), creating a short-run recessionary gap. In the IS-LM model, the increase in interest rates is represented by a leftward (upward) shift of the LM curve. This leads to a higher equilibrium interest rate and lower output, reinforcing the decline in economic activity seen in the AD-AS model. In the labor market, the fall in the price level increases the real wage, which in this framework leads to an increase in labor supply (Ls shifts right). This reflects workers responding to higher real wages, although overall economic activity is still contracting. Overall, across all three models, the policy reduces output and slows the economy in the short run, which helps bring down inflation but comes at the cost of lower production and weaker labor market conditions.
How successful was the model?
Short Run:
In the short run following the 2022 contractionary monetary policy, inflation in Norway remained relatively high initially before beginning to slow. This reflects short-run price stickiness, where the price level does not immediately fall even though aggregate demand shifts left. While the AD-AD model predicts a decrease in the price level, in reality the adjustment is more gradual, with inflation slowing before prices fully respond.
Long Run:
In the long run, inflation declines more noticeably as the effects of higher interest rates reduce demand in the economy. This is consistent with the AD-AS model, where a sustained leftward shift in aggregate demand leads to a lower price pressure and a stabilization of the price level over time.
Short Run:
In the short run, output growth weakened as higher interest rates reduced consumption and investment. This aligns with the AD-AS model, where contractionary monetary policy leads to a decrease in output due to lower aggregate demand.
Long Run:
In the long run, output returns toward its natural level as the economy adjusts. While growth may remain positive, it stabilizes at a more sustainable level. This is consistent with the AD-AS framework, where output converges back to Yn even after a short-run decline.
Short Run:
In the short run, interest rates in Norway increased following the 2022 contractionary monetary policy. In the IS-LM model, this is represented by a leftward shift of the LM curve, which raises the equilibrium interest rate and lowers output. This is consistent with the data, as tighter monetary conditions lead to higher borrowing costs and reduced economic activity.
Long Run:
In the long run, as the price level decreases, real money balances increase, which causes the LM curve to shift back to the right. This puts downward pressure on interest rates, allowing them to stabilize or decrease from their short-run peak. This adjustment is consistent with the IS-LM framework, where changes in the price level help restore equilibrium over time.
Short Run: In the short run, the model would predict that consumption would decrease because output decreases and the interest rate increases. In 2021, before the contractionary monetary policy was introduced, the final consumption expenditure was 2.52 trillion. When the interest rate was being raised in 2022, the final consumption expenditure was 2.66 trillion. In 2023, the final consumption expenditure was 2.67 trillion. In 2024, the final consumption expenditure was 2.72 trillion.
Long Run: In the long run, the model would predict that consumption would stay the same because the output and the interest rate stay the same.
Short Run: In the model, investment was expected to decrease because the interest rate increased in the short run in the IS-LM model. Investment was measured through the producer price index for investment goods domestically. In quarter 1 of 2022, the producer price index was 120.41. In quarter 2 of 2022, when the interest rate was raised, the producer price index was 125.11. In quarter 3 of 2022, when the interest rate was raised again, the producer price index was 127.38. In quarter 4 of 2022, the producer price index was 128.81.
Investment increased in 2022 which follows how the model predicted investment would increase in the short run. Investment likely increased due to increased oil and gas spending and growth of the Norwegian sovereign wealth fund. Foreign direct investment also remained stable and the country increased its investment security screenings.
Long Run: In the model, investment in the long run would remain the same because the interest rate would remain the same.
Short Run: The labor market model predicted an increase in the labor supply which would decrease employment in the short run. The employment can be measured using the total employment and the employment ratio. The employment to population ratio for those 15 years or older as a total percent of the population in Norway was 63 in 2021. This increased to 64 in 2022 after the contractionary monetary policy changes. It remained at 64 in 2023, then decreased to 63 in 2024 and 2025. This shows how the employment briefly increased after the interest rate change but ultimately remained the same. The total number of employees increased from 2021 to 2024. In 2021, 2,644,250,25 people were employed which increased each year until it reached 2,745,324.75 people employed in 2024. This shows how the total employment increased in the short run. The labor market shows some rising employment, but it has been low enough that some metrics would consider the employment to be stable. Neither of these would agree with the estimates of the labor market model.
Long Run: In the model, the labor market in the long run would remain the same because the price expectations would equal the actual prices.
Short Run: In the short run, real wages are expected to increase due to the increase in labor supply predicted by the model. The actual real wage growth has been minimal from 2015-2023 according to Statistics Norway. The year 2024 was expected to have the first real wage growth with forecasts estimating around 1.9%.
Long Run: The model predicts real wages will remain the same in the long run because the price expectations will be equal to the actual prices and the labor market will adjust.
Discrepancies and Interpretation
The consumption in the short run was expected to decrease, however, the final consumption expenditure from 2022 to 2024 actually increased. The measurement of the final consumption expenditure is in NOK adjusted for inflation. There was about a 10 billion NOK increase in 2023 and a 50 billion NOK increase in 2024. The contractionary monetary policy did not start until March 2022 where Norges bank increased the interest rate from 0% to 0.75%. In June, the interest rate was increased again to 1.25% and then again in December to 2.75%. This slower introduction of the change in the interest rate could mean the impacts did not have a high enough magnitude to impact the consumption more than other impacts. These other impacts could include the impacts of Covid on different industries, supply-chain impacts, and the housing and car markets. There were also electricity subsidies in 2023 which could have accounted for households having more money to spend. It is also possible that consumer sentiment was playing a role in the consumption outcome. In 2022, there were multiple reasons consumer sentiment could have changed. The Russian invasion of Ukraine and increased defense spending by Norway could have lowered consumer sentiment which would not be in line with these outcomes. The post-pandemic economic changes along with the reopening of many industries could have increased consumer sentiment. Since consumer sentiment is hard to determine, it is possible this is the reason for the increase in consumption. Another factor to acknowledge is that prior to the Covid pandemic in 2020, the final consumption expenditure has trended upward since measurement started in 1970.
The Norges Bank believes that employment has continued to rise and there have been greater shortages of labor. The Norges Bank also notes that the increased employment has been “particularly strong in the industries most affected by pandemic-related conditions”. The report from the Norges Bank also mentions how the employment rate is at its highest level in more than ten years. This information from the Norges Bank could mean there are further indicators in the labor market that are suggesting a better market, beyond the employment ratio and total employment. The model predicts a higher labor supply which can be seen with lower unemployment rates and higher number of employed people. It is also possible, however, that the labor demand may have increased as well due to post-pandemic conditions not fully accounted for by the model. The Norges Bank claims it is a tight labor market which means that the demand for workers exceeds the supply of workers. This could mean that the model we predicted is inaccurate because the real Norwegian economy has not yet reached this equilibrium, but given how the data has remained stable for a few years, it is likely the labor demand. If the labor demand increased after the Covid pandemic, the labor demand curve would shift out which would lead to a higher employment and the results that are being seen. Adapting our model to account for this labor demand, with further evidence of its existence in Norway, could help our model become more accurate to real-world circumstances.
Sources
https://defense.info/defense-decisions/2022/03/norway-increases-short-term-defense-spending-march-2022/
https://data.worldbank.org/indicator/MS.MIL.XPND.CN?locations=NO
https://www.norges-bank.no/en/news-events/publications/Monetary-Policy-Report/2022/mpr-22022/content/#:~:text=Employment%20has%20continued%20to%20rise,high%20number%20of%20job%20vacancies
https://www.ampeco.com/ev-charging-grants-incentives/norways-stromstotte-funding-program/
https://www.ssb.no/en/energi-og-industri/industri-og-bergverksdrift/statistikk/investeringer-i-olje-og-gass-industri-bergverk-og-kraftforsyning/articles/clear-growth-in-petroleum-investment-in-2024#:~:text=Total%20accrued%20investments%20in%20oil,activity%20in%20fields%20on%20stream.&text=Bar%20chart%20with%2011%20bars,current%20NOK%2C%20and%20values.&text=End%20of%20interactive%20chart.&text=Quarterly%20investment%20statistics%20for%20oil,(lenke).
https://no.usembassy.gov/wp-content/uploads/sites/55/2026/01/638719_2025-Norway-Investment-Climate-Statement.pdf
https://data.worldbank.org/indicator/SL.EMP.TOTL.SP.ZS?end=2025&locations=NO&start=2021&view=chart
https://fred.stlouisfed.org/series/LFESEETTNOQ647S#
https://data.worldbank.org/indicator/NE.CON.TOTL.KN?end=2024&locations=NO&start=1970&view=chart
https://www.ssb.no/en/nasjonalregnskap-og-konjunkturer/konjunkturer/statistikk/konjunkturtendensene/articles/real-wage-growth-expected-in-2024
https://www.ssb.no/en/nasjonalregnskap-og-konjunkturer/konjunkturer/statistikk/konjunkturtendensene/articles/highest-real-wage-growth-in-over-ten-years
https://fred.stlouisfed.org/series/CLVMNACSCAB1GQNO
https://ycharts.com/indicators/norway_real_interest_rate
https://data.worldbank.org/indicator/FR.INR.RINR?end=2024&locations=NO&start=2013&view=chart
https://www.ssb.no/en/priser-og-prisindekser/konsumpriser/statistikk/konsumprisindeksen
The Norwegian Banking Crisis and Economic Growth
Event description and historical context
The Norwegian banking crisis is a major financial crisis that occurred in Norway and other Nordic countries, such as Denmark, Sweden, and Finland, in 1988–1992. It followed financial deregulation in the 1980s, which helped trigger a lending boom, high-risk bank activities, and a massive real estate bubble. While earlier economic shocks formed part of the background, the crisis was mainly driven by deregulation, rapid credit expansion, and later high real interest rates and falling property prices.
From 1987 to 1990, mainly smaller banks suffered increased losses on loans and weaker operating results. The Savings Banks’ Guarantee Fund and the Commercial Banks’ Guarantee Fund offered these banks support and equity contributions. Many banks were merged, but the economic situation was still relatively stable since depositors’ money remained protected.
Towards the end of 1990, problems also appeared at the larger banks, and it was widely recognized that the crisis was systemic. The second half of the banking crisis was broad and deep, strongly influenced by high real interest rates and falling property prices in the Norwegian economy. The crisis peaked in the fall of 1991 when both the second-largest and fourth-largest banks in Norway became insolvent, and the largest bank had serious problems.
The financial deregulation policy was thought to release a huge credit supply shock that increased aggregate demand and asset prices. Large asset price movements triggered fluctuations in consumption as well as investment. There is also consideration of the relationship between the political system and the crisis. Norway may now have the most powerful ministry of finance among OECD countries (relative to the economy’s size), and this increase in the power of economists in the Norwegian government seems to have occurred about the same time as the banking crisis.
Macroeconomic Impacts and Data Visualization
The banking crisis affected Norway through weaker output, falling inflation, rising unemployment, and pressure on public finances.
Real GDP
Examining the real GDP of Norway, during the period of the banking crisis, there was a decline in the third quarter of 1990 and 1991. They loosely align with the fall of 1991, the peak of the crisis defined by the Bankenes Sikringsfond. However, overall longer-term trend still remained upward.
Inflation
The inflation declined during the crisis. From this data, the inflation started to decline in 1987, exactly when the banking distress started in Norway, and continued to decrease until 1994, one or two years after the crisis.
Unemployment Rate
The unemployment rate steadily rose between 1989 and 1993, which again aligns with the crisis period. The increase from the end of 1991 to the beginning of 1992 is especially dramatic, and it stayed at a similar level for about one or two more years after that. At the same time, as the crisis approached its end, the unemployment rate decreased in 1994 and fluctuated at a lower level afterward than during the crisis.
Norway Government International Debt Securities
The debt issued by the Norwegian government began increasing in the mid-1980s, rose gradually until the early 1990s, and grew more rapidly between 1992 and 1996. This pattern aligns with the Norwegian banking crisis (late 1980s–early 1990s), during which the government intervened heavily to stabilize the financial system. These interventions were partly financed through increased borrowing, including international debt issuance. After the crisis was resolved by the mid-1990s, government borrowing declined, and debt levels fell. While the crisis had lasting fiscal effects, the persistence of debt reflects broader financing decisions and debt dynamics rather than continued large-scale bank support into the 2000s.
AD–AS model interpretation
The AD curve shifts left due to a negative financial shock originating in the banking sector.
As banks experienced losses and became undercapitalized, they reduced lending, leading to a credit crunch.
This reduced consumption, as households faced tighter borrowing constraints. As a result, aggregate demand declined.
- This is consistent with the data:
- inflation fell during the crisis,
- unemployment increased, and
- output showed short-run weakness.
In the AD–AS model, this corresponds to a leftward shift of AD, leading to lower output and a lower price level in the short run.
Negative Demand Shock — Move both graphs together
AD–AS: Consumer sentiment falls, AD shifts left
IS–LM: IS shifts left from spending decline; LM shifts right as prices fall
Policy response and aftermath
The Norwegian government created several funds to recapitalize struggling banks. The two industry-financed guarantee funds established early in the crisis: the Savings Banks’ Guarantee Fund and the Commercial Banks’ Guarantee Fund were depleted as conditions worsened. In response, the government established the Government Bank Insurance Fund in 1991 to provide emergency capital directly to banks, followed by the Government Bank Investment Fund to take equity stakes in banks not in acute distress. Through these arrangements, the state took over the three largest commercial banks, DnB, Christiania Bank, and Fokus Bank—wiping out existing shareholders before recapitalizing them. This decisive intervention stabilized the financial system and allowed Norway to recover more quickly than its Nordic neighbors, with GDP growth resuming by 1993. The government later recovered most of its capital injections through privatization, and the two funds were wound up in 2002 and 2004, respectively. Norway’s approach is now widely regarded as a model for resolving systemic banking crises.
Overview and Drivers of Economic Growth
Norway’s economic growth story is largely defined by the discovery of North Sea oil in 1969, with commercial production beginning in the early 1970s. Before this, Norway was a stable but unremarkable European economy, with growth driven by fishing, shipping, and manufacturing. The oil discovery changed everything, shifting the economy away from these traditional industries toward an oil-dominated export sector and driving sharp increases in GDP per capita over the following decades.
The oil boom was not without complications. Price shocks in 1973 and 1979 created significant volatility, and rapid credit expansion through the mid-1980s contributed to overheating and eventually the banking crisis of 1988-1992. Despite these disruptions, the long-run trajectory remained upward, and by the mid-1990s, Norway had entered a prolonged period of strong, stable growth with GDP per capita pulling well ahead of the OECD average.
A key reason Norway avoided the “resource curse” is its management of petroleum revenues through the Government Pension Fund Global, established in 1990. A fiscal rule adopted in 2001 limits annual spending from the fund to its expected deal rate of return, preventing overheating and Dutch Disease. The fund is now worth over $1.7 trillion and acts as a long-term financial cushion for future generations.
Beyond oil, growth has been supported by rising educational attainment, expanding female labor force participation from the 1970s onward, and productivity gains driven by technological advancement in petroleum and knowledge-intensive services. Structural transformation away from traditional industries, combined with strong institutions and disciplined fiscal management, has allowed Norway to translate its resource wealth into lasting and broadly shared prosperity.
Data Visualizations and Interpretation
This graph represents the index of human capital per person in Norway from 1950 to 2023. The index of human capital takes into account years of schooling and return to higher education.
Higher index levels represent higher education levels which are supposed to correlate with higher productivity levels.
Norway’s changes to compulsory schooling has helped increase the index score since 1950. In 1969, a nine-year compulsory education was introduced. In 1997, it increased to ten years.
Higher education also increased since 1950. A 1994 Reform granted all young people aged 16-19 a statutory right to three years of upper secondary education (academic or vocational).
In 1950, 8.4% of Norwegians of the relevant age group had completed some upper secondary schooling. By 2010, 70% of Norwegians had.
Higher education completion also increased from 3-4% in 1950 to 44% in 2010.
This graph shows the growth rate for total industries, excluding construction, from the previous year.
The period with the highest growth rate was 1986. This is surprising because in 1986 had a sharp drop in oil prices (about 20%) and there was a significant tightening of monetary and fiscal policy. Despite this, private consumption and investment were still growing. This was due to deregulation that allowed for the expansion of credit.
The growth rate has been positive from 1956 to 1997, most likely due to post-war reconstruction, expansion of the shipping sector, the discovery of oil, and high investment.
The decreased growth rate in 1998 was mostly linked to the crisis in Russia led to a depreciation of the Norwegian krone, rose interest rates, and weakened domestic demand.
In 2004, there was a sharp appreciation of the krone, high wage inflation, and a slump in international demand which led to reduced investment and increased unemployment.
The decrease in the growth rate from 2009 to 2011 was due to the Great Recession which caused a decrease in international demand of Norwegian goods.
Norway GDP per capita mostly increased and remained consistent from 1960 to 2000. In 2000, GDP per capita increased significantly until 2008. Since 2008, there has been more significant increases and decreases in the GDP per capita.
The increase from 2000 to 2008 can largely be attributed to the oil industry. The growth in GDP per capita started increasing less due to falling oil prices, reduced productivity growth, and reduced contribution by the petroleum sector. In 2008, Norway started prioritizing independence from their reliance on the oil sector and working in increasing other sectors.
From 2014 to 2016, Norway had a 70% decrease in crude prices and a 20% reduction in the value of the Norwegian krone. In 2016, consumer confidence was at its lowest in 24 years and unemployment was at a 10-year high.
The decrease in GDP per capita in 2020 is most likely a result of the Covid pandemic and recession.
Sources
Sources:
Bank for International Settlements, Amount Outstanding of International Debt Securities for Issuers in General Government Sector, All Maturities, Residence of Issuer in Norway [IDSGAMRIAONO], retrieved from FRED, Federal Reserve Bank of St. Louis; https://fred.stlouisfed.org/series/IDSGAMRIAONO, May 6, 2026.
Board of Governors of the Federal Reserve System (US), Norwegian Kroner to U.S. Dollar Spot Exchange Rate [DEXNOUS], retrieved from FRED, Federal Reserve Bank of St. Louis; https://fred.stlouisfed.org/series/DEXNOUS, May 6, 2026.
Eitrheim, Øyvind & Qvigstad, Jan Fredrik. “Norway’s Road to Inflation Targeting.” Norges Bank, 13 Mar. 2020, https://www.norges-bank.no/bankplassen/arkiv/2020/norways-road-to-inflation-targeting/.
Elstad, E. 2023. The Evolution of extended universal compulsory schooling in Sweden, Norway and Denmark: Policy Borrowing and path-dependent processes. Nordic Studies in Education, 43(1), 94–110. https://doi.org/10.23865/nse.v43.5422
Eurostat, Real Gross Domestic Product for Norway [CLVMNACSCAB1GQNO], retrieved from FRED, Federal Reserve Bank of St. Louis; https://fred.stlouisfed.org/series/CLVMNACSCAB1GQNO, May 6, 2026.
Fouche, Gwladys, and Terje Solsvik. 2016. “Norway’s Economy Loses Its Shine.” Reuters, February 16, 2016. https://www.reuters.com/article/business/norways-economy-loses-its-shine-idUSKCN0VP1LK/.
Governor Svein Gjedrem. 2026. “The Economic Situation in Norway.” Norges-Bank.no. 2026. https://www.norges-bank.no/link/91b391ba6aa841678e71812615f0c0b4.aspx/?epslanguage=en.
Nicolaisen, Jon, and Jan Qvigstad. n.d. “Monetary Policy in Norway -Experience since 1992.” https://www.bis.org/publ/plcy02g.pdf.
Norges Bank Investment Management (NBIM), About the Fund. https://www.nbim.no/en/the-fund/about-the-fund/
Organization for Economic Co-operation and Development, Infra-Annual Labor Statistics: Monthly Unemployment Rate Total: 15 Years or over for Norway [LRHUTTTTNOM156S], retrieved from FRED, Federal Reserve Bank of St. Louis; https://fred.stlouisfed.org/series/LRHUTTTTNOM156S, May 6, 2026.
Organization for Economic Co-operation and Development, Production: Industry: Total Industry Excluding Construction for Norway [NORPRINTO01GPSAM], retrieved from FRED, Federal Reserve Bank of St. Louis; https://fred.stlouisfed.org/series/NORPRINTO01GPSAM , May 6, 2026.
Lindbekk, Tore. 2015. “Educational Policies Changed Norwegian Attainment Patterns 1950-2010.” Journal of Political Sciences & Public Affairs s1 (0). https://doi.org/10.4172/2332-0761.1000s1.008 .
Qvigstad, Jan F. 2025. “The Global Economic Crisis and Its Impact on Sovereign Wealth Funds: The Example of Norway.” Norges-Bank.no. 2025. https://www.norges-bank.no/aktuelt/nyheter/Foredrag-og-taler/2009/The-global-economic-crisis-and-its-impact-on-Sovereign-Wealth-Funds-The-example-of-Norway/.
Steigum, Erling. “The Norwegian Banking Crisis in the 1990s: Effects and Lessons.” Department of Economics BI Norwegian School of Management, 2010. file:///C:/Users/user/Downloads/567.pdf.
Thuen, Harald, and Nina Volckmar. 2020. “Postwar School Reforms in Norway.” in Kathy Hytten (ed.), Oxford Research Encyclopedia of Education (New York, NY, online edn, Oxford Academic, 9 June 2016), https://doi.org/10.1093/acrefore/9780190264093.013.1456, accessed 6 May 2026.
University of Groningen and University of California, Davis, Capital Stock at Constant National Prices for Norway [RKNANPNOA666NRUG], retrieved from FRED, Federal Reserve Bank of St. Louis; https://fred.stlouisfed.org/series/RKNANPNOA666NRUG,
University of Groningen and University of California, Davis, Index of Human Capital per Person for Norway [HCIYISNOA066NRUG], retrieved from FRED, Federal Reserve Bank of St. Louis; https://fred.stlouisfed.org/series/HCIYISNOA066NRUG,
World Bank, Constant GDP per capita for Norway [NYGDPPCAPKDNOR], retrieved from FRED, Federal Reserve Bank of St. Louis; https://fred.stlouisfed.org/series/NYGDPPCAPKDNOR, May 6, 2026.
World Bank, Inflation, consumer prices for Norway [FPCPITOTLZGNOR], retrieved from FRED, Federal Reserve Bank of St. Louis; https://fred.stlouisfed.org/series/FPCPITOTLZGNOR, May 6, 2026.
1987 The Norwegian Banking Crisis. Bankenes Sikringsfond. n.d. https://www.bankenessikringsfond.no/about-us/history/the-norwegian-banking-crisis.